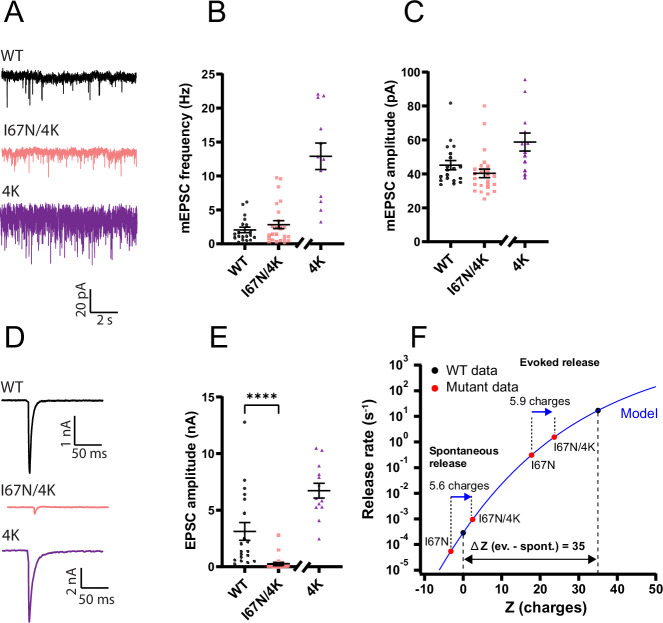
Figure 12. Adding positive surface charges to the SNARE complex partly compensate for the I67N mutation.

(A) Example traces of mEPSC release for wildtype (WT), I67N/E183K/S187K/T190K/E194K (I67N/4K) and E183K/S187K/T190K/E194K (4K) SNAP25b. Data from the 4K mutation were obtained in a separate experiment and are shown for comparison, but statistical tests with 4K mutation data were not carried out. (B) The mini frequencies for the WT and I67N/4K are not significantly different; data from the 4K mutation are shown for comparison (n = 19, 25, 13 for WT, I67N/4K, and 4K, respectively). (C) Mini amplitudes remain unaffected by I67N/4K mutation. eEPSC examples (D) and amplitudes (E) for WT and I67N/4K; 4K is shown for comparison (n = 19, 25, 13 for WT, I67N/4K, and 4K, respectively). ****p < 0.0001 Mann–Whitney test. (F) Electrostatic triggering model (blue line; Ruiter et al., 2019) refitted to WT spontaneous and evoked data points (black points). Fitted parameters: rate 0.00029 s−1 at zero (0) charge (Z); fraction f = 0.030; the maximum rate was fixed at 6000 s−1. WT (black points), I67N, I67N/4K (red points): means of log-transformed data. The charge values (Z, horizontal axis) for I67N and I67N/4K were found by interpolation in the model; the two spontaneous points (I67N, I67N/4K) are separated by 5.6 charges. For evoked release, rates were found by deconvolution and normalizing to RRP0.5 (Ruiter et al., 2019). The Z-values for evoked release were found by interpolation in the model; the two mutants (I67N, I67N/4K) are separated by 5.9 charges.
