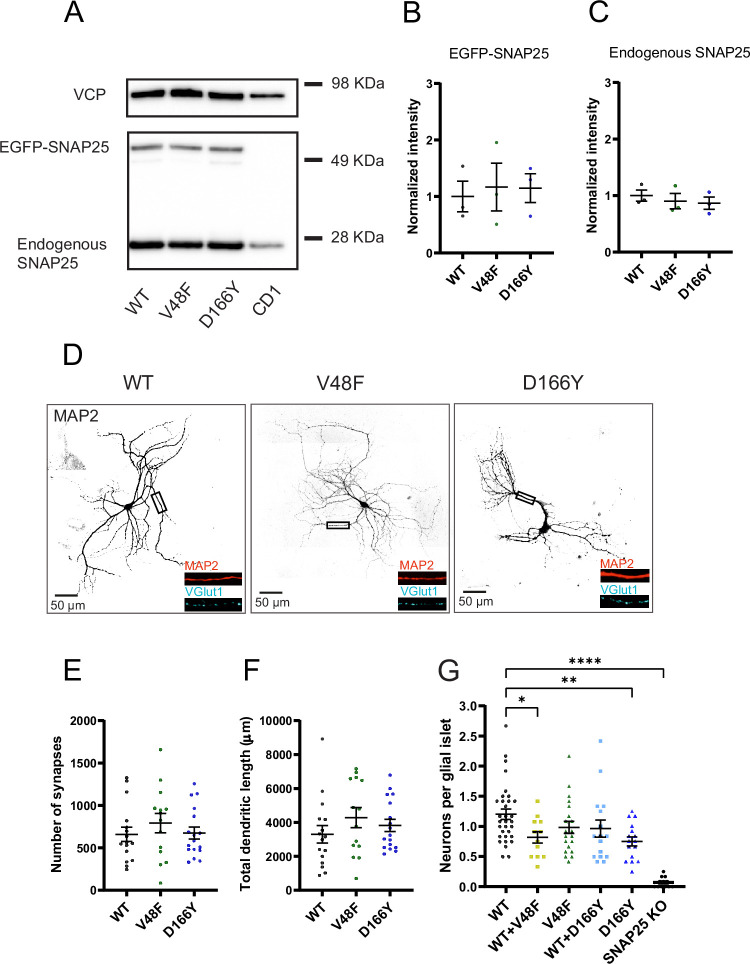
Figure 2. Pathogenic SNAP25 mutations compromise neuronal viability, but not synaptogenesis.

(A) SNAP25b V48F and D166Y mutations are similarly expressed as the wildtype (WT) SNAP25b protein. EGFP-SNAP25b was overexpressed in neurons from CD1 (WT) mice; both endogenous and overexpressed SNAP25 are shown. Valosin-containing protein (VCP) was used as loading control. Quantification of EGFP-SNAP25b (B) and endogenous SNAP25 (C) from Western blots (as in A). Displayed are the intensity of EGFP-SNAP25b or endogenous SNAP25 bands, divided by the intensity of VCP bands, normalized to the WT situation (n = 3 independent experiments). The expression level of mutants was indistinguishable from expressed WT protein (analysis of variance, ANOVA). (D) Representative images of control (WT) and mutant (V48F, D166Y) hippocampal neurons stained by dendritic (MAP2) and synaptic (VGlut1) markers. Displayed is MAP2 staining, representing the cell morphology, in inserts MAP2 staining is depicted in red and VGlut staining in cyan. The scale bar represents 50 µm. (E) Number of synapses per neuron in WT and mutant cells. (F) Total dendritic length of WT and mutant neurons. (G) Cell viability represented as the number of neurons per glia island. ****p < 0.0001, **p < 0.01, *p < 0.05, Brown–Forsythe ANOVA test with Dunnett’s multiple comparisons test.
