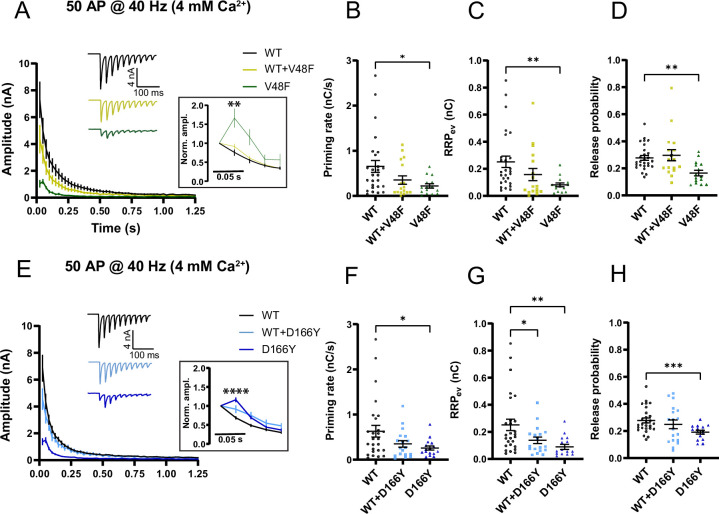
Figure 7. SNAP25 V48F and D166Y mutations change short-term plasticity toward facilitation.
(A, E) eEPSCs in response to 50 APs at 40 Hz recorded in 4 mM extracellular Ca2+ (V48F: 27, 17, 15 for wildtype [WT], co-expressed, and mutant conditions, respectively; D166Y: 27, 18, 16). Inserts: Normalized eEPSC amplitudes demonstrating facilitation of mutant conditions. ****p < 0.0001; **p < 0.01, Brown–Forsythe analysis of variance (ANOVA) with Dunnett’s multiple comparison test. (B, F) Priming rate calculated as the slope of a linear fit to the cumulative evoked charges during the last part of stimulation (V48F: 27, 17, 15 for WT, co-expressed, and mutant conditions, respectively; D166Y: 27, 18, 16). *p < 0.05, ANOVA (V48F) or Brown–Forsythe ANOVA (D166Y) with Dunnett’s multiple comparisons test. (C, G) Readily releasable pool (RRP) calculated by back-extrapolation of a linear fit to the cumulative evoked charges during the last part of stimulation (V48F: 27, 17, 15 for WT, co-expressed, and mutant conditions, respectively; D166Y: 27, 18, 16). **p < 0.01, *p < 0.05, ANOVA (V48F), or Brown–Forsythe ANOVA (D166Y) with Dunnett’s multiple comparisons test. (D, H) Release probability calculated as the charge of the first evoked response divided by the RRP obtained by back-extrapolation (V48F: 27, 17, 15 for WT, co-expressed, and mutant conditions, respectively; D166Y: 27, 18, 16). ***p < 0.001; **p < 0.01, ANOVA (V48F), or Brown–Forsythe ANOVA (D166Y) with Dunnett’s multiple comparisons test.

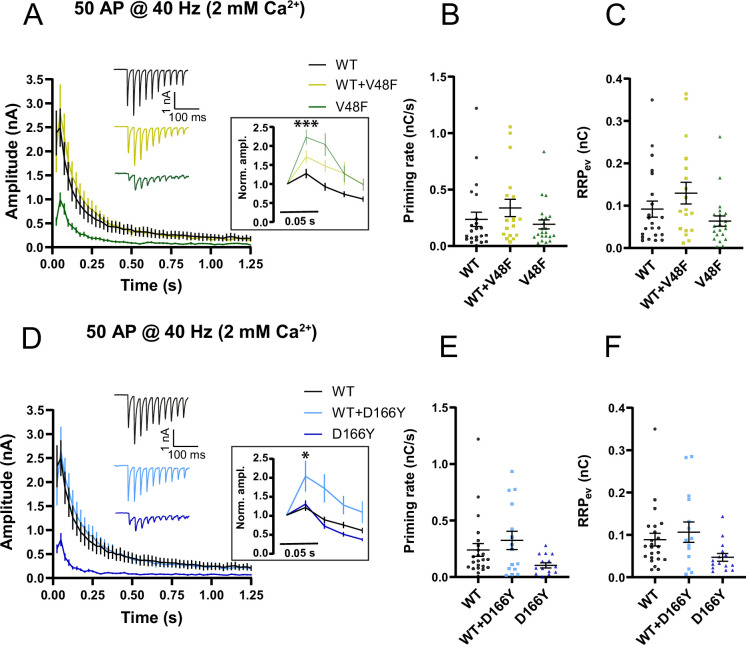
Figure 7—figure supplement 1. Train stimulations of V48F and D166Y in 2 mM Ca2+.

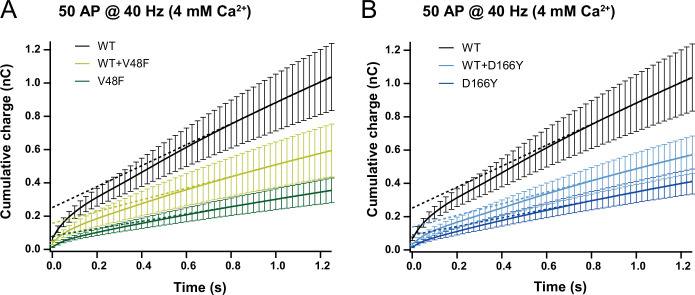
Figure 7—figure supplement 2. Cumulative charges of V48F and D166Y trains in 4 mM Ca2+.

