. 2024 Feb 27;12:RP88619. doi: 10.7554/eLife.88619

Figure 9. The D166Y mutation increases binding to its SNARE partners.

(A–C) In vitro lipid mixing assays of VAMP/Syt1 small unilamellar vesicles (SUVs) with syntaxin-1A giant unilamellar vesicles (GUVs) in the presence of soluble SNAP25b. V48F and D166Y mutants showed impaired fusion clamping in the absence (left) or presence (right) of complexin-II; I67N (red) showed impaired Ca2+-independent and Ca2+-triggered fusion. Bar diagrams show lipid mixing just before (pre) and after (post) Ca2+ addition and at the end of the reaction. Mean ± standard error of the mean (SEM; n = 3). ****p < 0.0001; ***p < 0.001; **p < 0.01; *p < 0.05, analysis of variance (ANOVA) with Dunnett’s multiple comparisons test, comparing each mutation to the corresponding wildtype (WT) condition. (D) SNAP25b D166Y showed enhanced interactions with SUVs carrying reconstituted syntaxin-1A (Stx-1), VAMP2, Syt1/VAMP2, or an SUV mixture containing Syntaxin-1A and VAMP2/Syt1 in co-flotation assays, whereas V48F displayed weaker increases in interactions with SUVs containing syntaxin-1A, or Syt1/VAMP2. Shown is mean ± SEM on a logarithmic scale. ***p < 0.001, **p < 0.01, *p < 0.05, two-tailed one-sample t-test comparing to 1.

Figure 9—source data 1. Excel file containing quantitative data.

Figure 9.

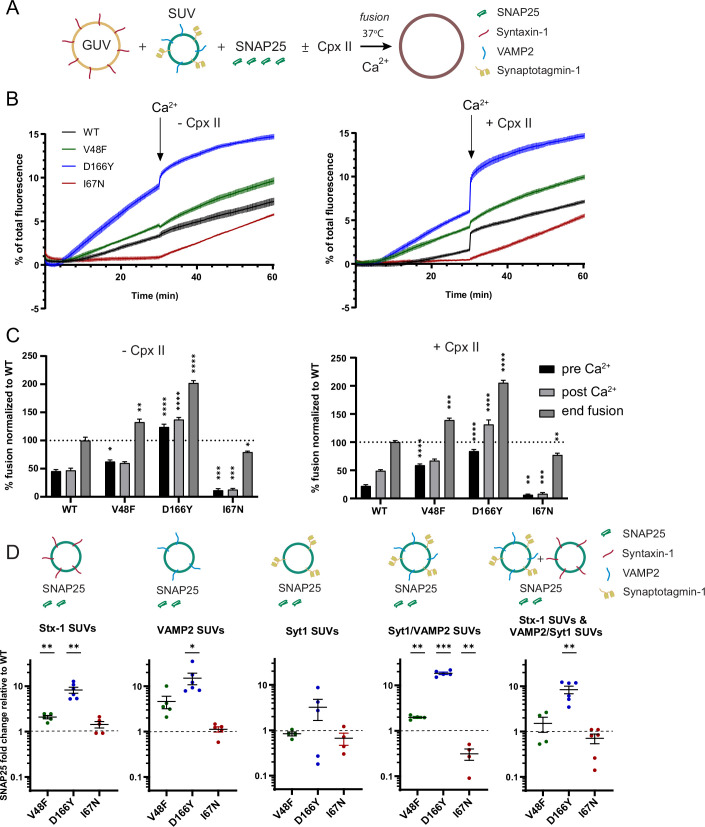
Figure 9—figure supplement 1. Floatation assay.

Figure 9—figure supplement 1.

Example Coomassie and silver stained gels demonstrating binding of SNAP25b wildtype (WT) and mutants to different populations of small unilamellar vesicles (SUVs): Syntaxin-1 (Stx-1) and VAMP2/Syt1, Syntaxin-1 (Stx-1), VAMP2/Syt1, VAMP2, or Syt1 SUVs. Note increased binding of D166Y and V48F to most SUV populations, strongest for D166Y (quantified data in Figure 9D).
Figure 9—figure supplement 1—source data 1. Original files for the analysis by Coomassie and silver stained gels.
Figure 9—figure supplement 1—source data 2. PDF containing original pictures of gels with highlighted bands and sample labels.
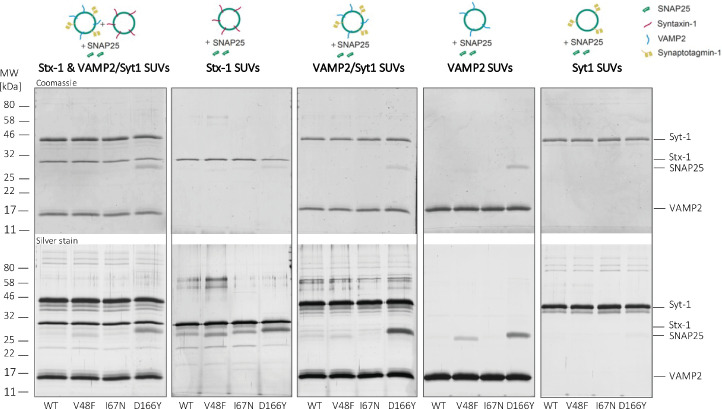
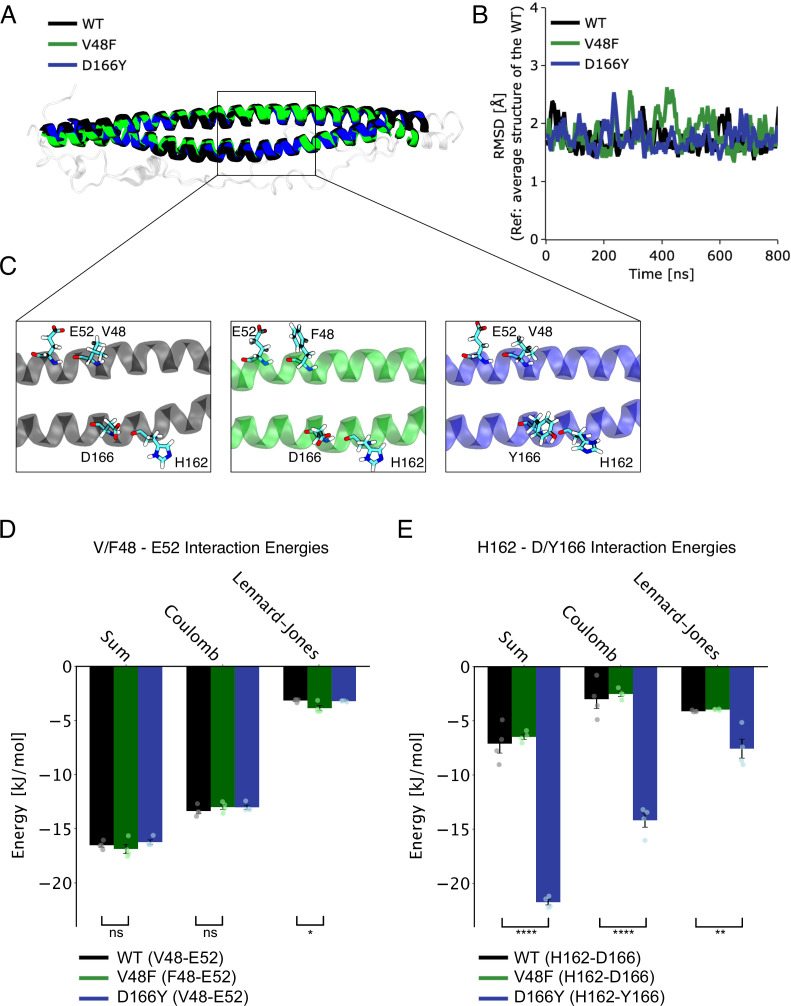
Figure 9—figure supplement 2. Molecular dynamics simulations of mutants.

Figure 9—figure supplement 2.

(A) Alignment of helices across the three systems (wildtype [WT], V48F, and D166Y) reveals close correspondence. The structures displayed represent the most prevalent configurations from the dominant cluster observed during simulations. (B) Stability evaluation (Root Mean Square Deviation, RMSD) of the two helices across the three systems relative to WT’s average structure during their simulations. (C) A detailed view of the region displaying residue pairs 48–52 and 162–166 on the structures. (D, E) Computed electrostatic (Coulomb) and van der Waals (Lennard–Jonson, LJ) interactions for residue pairs 48–52 (D) and 162–166 (E) calculated in 200 ns blocks within the 800 ns trajectory (see Materials and methods). The bar plots represent the means calculated using the block averaging method, while each block’s average is depicted as a dot alongside. The error bars capture the standard error of the mean, premised on treating each block as an independent measure (i.e. n = 4). Notably, for D166Y (panel E, blue bar), the interaction energy is considerably more negative, indicating a stronger interaction compared to WT. *p < 0.05, **p < 0.01, ****p < 0.0001, one-way analysis of variance (ANOVA) with Tukey HSD post hoc tests.
Figure 9—figure supplement 2—source data 1. Excel file with quantitative data.