. 2023 Dec 15;23(3):285–300. doi: 10.1158/1535-7163.MCT-23-0351

Figure 2.

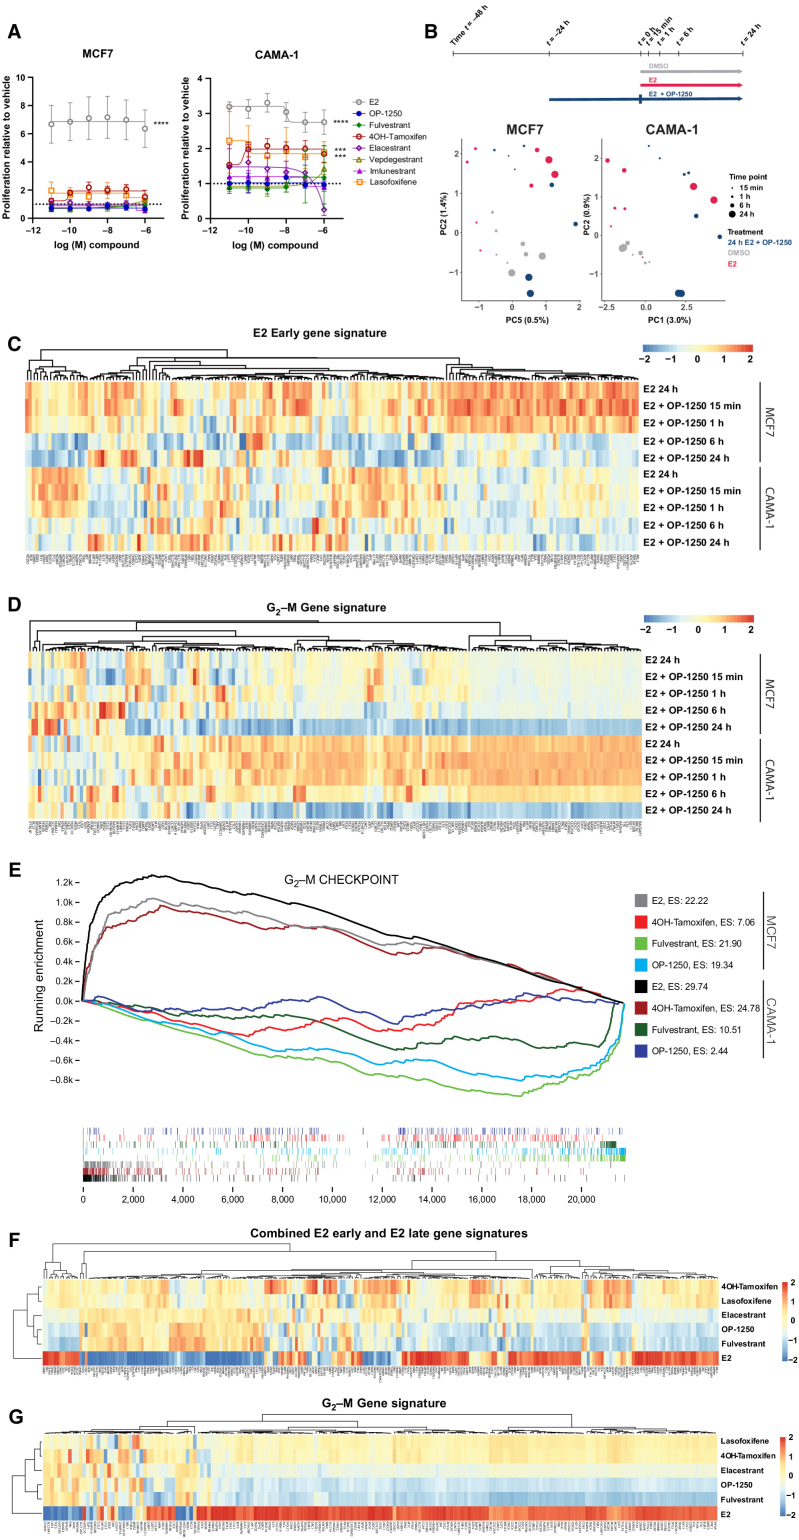
Figure 2. OP-1250 effectively blocks estrogen-induced transcriptional activity and lacks agonist activity on breast cancer cells in the absence of estrogen. A, Cellular proliferation assay of MCF7 and CAMA-1 cells treated over 7 days with listed compounds in the absence of E2 supplementation. Proliferation is assessed by CyQUANT reagent and normalized to DMSO vehicle, the value of which is indicated by the horizontal dotted line. Data is represented as mean and SD of at least three independent experiments. ****, Padjusted value < 0.0001 and ***, Padjusted value < 0.001. B, Schematic of PRO-seq treatment strategy and sample collection timepoints for MCF7 and CAMA-1 cells (above) and principal component analysis of DMSO, E2, and E2 + OP-1250 treatments (below), with timepoint indicated by circle size and treatment indicated by color. C and D, Heat maps of genes associated with E2 early gene signature or G2–M gene signature in 24 hours E2 and E2 + OP-1250 PRO-seq samples, with red indicating high expression relative to vehicle and blue indicating low expression relative to vehicle. E, Gene set enrichment analysis of G2–M checkpoint gene set at 24 hours PRO-seq timepoint with genes ranked from high to low expression relative to vehicle (x-axis) and plotted lines tracking running enrichment (y-axis). Ticks below graph represent individual genes. Upward peak toward left side of graph indicates enrichment in activation of gene expression while a downward peak toward right side of graph indicates enrichment in reduction of gene expression. F and G, Heat maps of annotated estrogen response and G2–M gene signatures in CAMA-1 mRNA-seq data. Cells were treated in triplicate with 100 pmol/L E2 or 316 nmol/L antiestrogen in estrogen-depleted media for 24 hours. Red indicates high expression relative to vehicle and blue indicates low expression.

OP-1250 effectively blocks estrogen-induced transcriptional activity and lacks agonist activity on breast cancer cells in the absence of estrogen. A, Cellular proliferation assay of MCF7 and CAMA-1 cells treated over 7 days with listed compounds in the absence of E2 supplementation. Proliferation is assessed by CyQUANT reagent and normalized to DMSO vehicle, the value of which is indicated by the horizontal dotted line. Data is represented as mean and SD of at least three independent experiments. ****, Padjusted value < 0.0001 and ***, Padjusted value < 0.001. B, Schematic of PRO-seq treatment strategy and sample collection timepoints for MCF7 and CAMA-1 cells (above) and principal component analysis of DMSO, E2, and E2 + OP-1250 treatments (below), with timepoint indicated by circle size and treatment indicated by color. C and D, Heat maps of genes associated with E2 early gene signature or G2–M gene signature in 24 hours E2 and E2 + OP-1250 PRO-seq samples, with red indicating high expression relative to vehicle and blue indicating low expression relative to vehicle. E, Gene set enrichment analysis of G2–M checkpoint gene set at 24 hours PRO-seq timepoint with genes ranked from high to low expression relative to vehicle (x-axis) and plotted lines tracking running enrichment (y-axis). Ticks below graph represent individual genes. Upward peak toward left side of graph indicates enrichment in activation of gene expression while a downward peak toward right side of graph indicates enrichment in reduction of gene expression. F and G, Heat maps of annotated estrogen response and G2–M gene signatures in CAMA-1 mRNA-seq data. Cells were treated in triplicate with 100 pmol/L E2 or 316 nmol/L antiestrogen in estrogen-depleted media for 24 hours. Red indicates high expression relative to vehicle and blue indicates low expression.