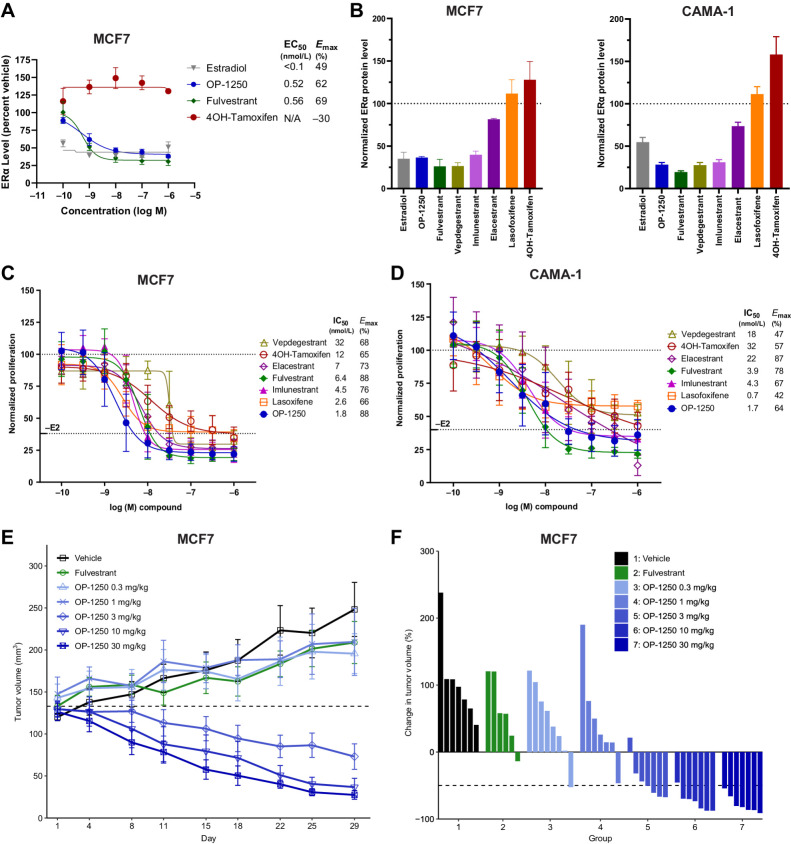
Figure 3.
OP-1250 displays in vitro and in vivo efficacy and degrades the ER in ER+ breast cancer models. A, Simple Western analysis of ERα protein levels in MCF7 cells after 24 hours treatment with listed compounds. Samples are normalized to untreated control, with mean and SD across three independent treatments shown. B, Simple Western analysis of ERα protein levels in MCF7 or CAMA-1 cells after 24 hours of treatment with 300 nmol/L compound or 1 nmol/L E2. Samples are normalized to untreated control, represented by dotted line, with mean and SD across at least three independent treatments shown. C and D, Cellular proliferation of MCF7 and CAMA-1 cells treated with indicated dose of antiestrogen in the presence of 100 pmol/L E2. Proliferation assessed by CyQUANT reagent is normalized to E2-treated vehicle and shown as mean and SD across at least three experiments. E, Mean and SEM tumor volume over time with listed treatments in the MCF7 breast cancer model, with dotted line representing tumor stasis. Each group represents at least 6 animals. F, Percent change in tumor volume of individual animals in listed treatment groups at day 29 of MCF7 xenograft study, normalized to day 1 tumor volume.

