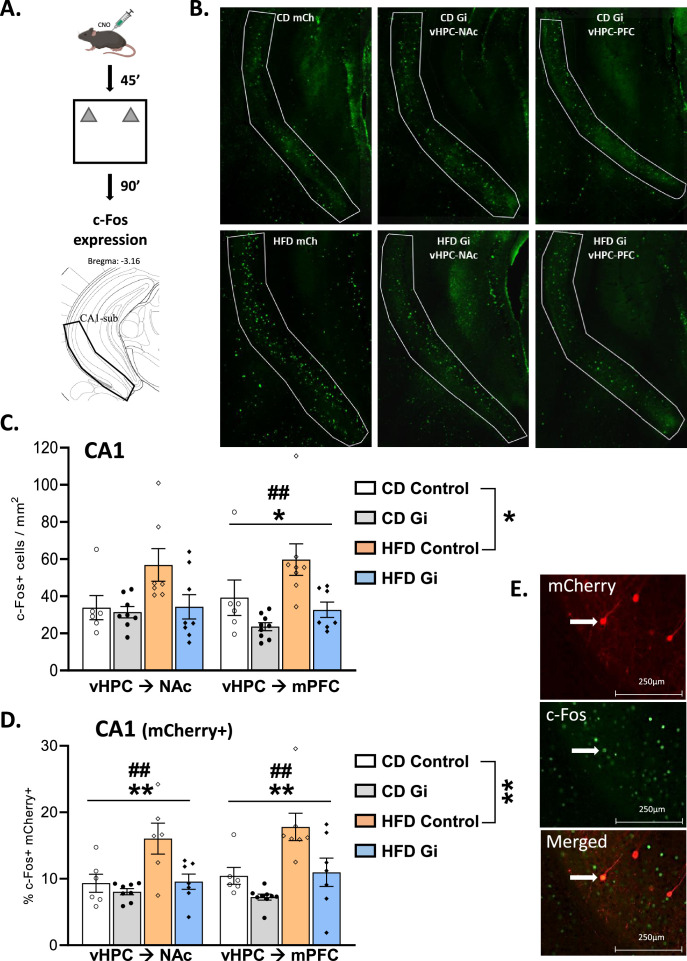
Figure 2. Effects of high-fat diet and chemogenetic silencing of ventral hippocampus (vHPC)–nucleus accumbens (NAc) or vHPC–medial prefrontal cortex (mPFC) pathway on c-Fos expression in ventral CA1/subiculum.
(A) Schema of exposure to a novel arena containing two identical and novel objects. (B) Representative images of c-Fos-positive (Fos+) cells in the ventral CA1/subiculum for each group. (C) Quantification of c-Fos+ cells in the ventral CA1/subiculum of the different groups. Data are shown as the number of c-Fos+ cells per mm2. The area corresponding to ventral CA1/subiculum area is delineated. Scale bar is set at 500 nm. (D) Representative example of mCherry and c-Fos labelling in the ventral CA1/subiculum. (E) Percentage of mCherry+ and c-Fos+ cells over total number of mCherry+ in the different groups. Scale bar is set to 250 nm and data are shown as a percentage of cells. Each point represents a single animal value. Diet effect: *p < 0.05, **p < 0.01; DREADD effect: ##p < 0.01 (two-way analysis of variance [ANOVA]).


