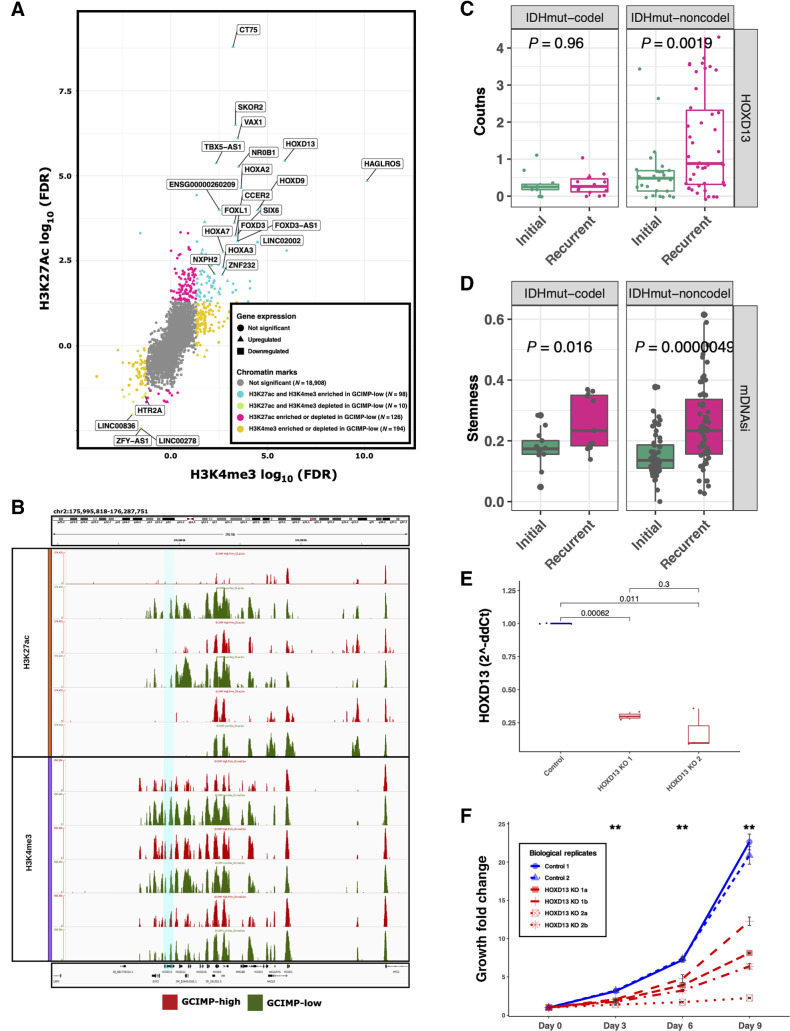
Figure 2.
Master regulators associated with IDHmut glioma recurrence/progression. A, Starburst plot of all H3K27ac and H3K4me3 peaks overlapping known transcription start sites. Significant gains or losses of H3K27ac (y-axis) and H3K4me3 (x-axis) are highlighted. Each dot indicates a gene and the shape indicates the expression difference between GCIMP-low versus GCIMP-high. Triangles, upregulated genes; squares, downregulated genes. If a gene is enriched for both H3K27ac and H3K4me3, this implies active TSS and the associated gene expression is defined as upregulated (turquoise, top right corner). If a gene is depleted for both H3K4me3 and H3K27ac, this implies weak or quiescent expression of the associated gene (green, bottom left corner). Gray, not significant gene promoter enrichment. Only the most significant upregulated genes are labeled in this plot. B, Genome browser representation focused on the HOXD family. The region related to HOXD13 gene (hg18.chr2: 176,092,721–176,095,944) is highlighted in turquoise. HOXD13 is more enriched by the H3K27ac and H3K4me3 peaks in the GCIMP-Low (recurrent) samples (n = 3) than in their corresponding GCIMP-High (primary) pairs (n = 3), top and bottom graph, respectively. C, HOXD13 expression level by RNA sequencing of GLASS IDHmut samples stratified by initial/recurrent and codel status (N = 11 codels and 26 noncodels patients). Each box represents quartiles, and the center line represents the median of each group. The whiskers represent absolute range. D, Stemness activity in the GLASS IDHmut samples stratified by initial/recurrent and codel status. Each box represents quartiles, and the center line represents the median of each group. The whiskers represent absolute range. E, Quantification analysis of the relative HOXD13 expression levels (2-ΔΔCt) between samples: control, n = 2; HOXD13 1 sgRNA HOXD13–07, n = 2; HOXD13 2 sgRNA HOXD13–55, n = 2 biological replicates. The boxplots represent the analysis of three technical replicates for each sample. F, Proliferation growth curve over 9 days of analysis (control, N = 2; HOXD13 1 sgRNA HOXD13–07, N = 2; HOXD13 2 sgRNA HOXD13–55, N = 2 biological replicates). **, P < 0.01

