. 2024 Jan 4;84(5):725–740. doi: 10.1158/0008-5472.CAN-23-1398

Figure 3.

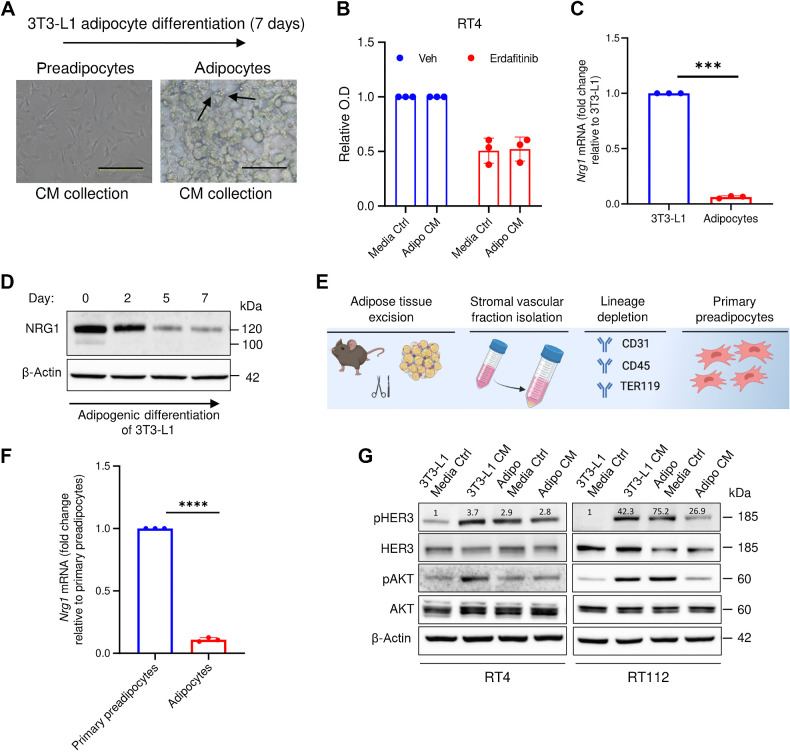
Figure 3. NRG1-mediated resistance against erdafitinib is restricted to preadipocytes. A, Representative images showing the adipogenic differentiation of 3T3-L1 cells (preadipocytes) to differentiated adipocytes. The differentiation process was carried out for 7 days. Arrows, formation of lipid droplets in adipocytes. B, Proliferation analysis of RT4 cells treated with 10 nmol/L erdafitinib in media control (ctrl) or CM of adipocytes collected after 7 days of differentiation. Crystal violet staining was performed on day 7. Data were normalized to cells treated with vehicle. Three biological replicates were performed. Data are represented as mean ± SD. C, qRT-PCR analysis of baseline NRG1 expression in 3T3-L1 cells and 3T3-L1-derived adipocytes. Three biological replicates were performed. Expression levels are normalized to GAPDH. Data are represented as mean ± SD. D, Western blot analysis of NRG1 in 3T3-L1 under adipogenic differentiation. β-Actin served as a loading control. E, Schematic illustration of the process of isolating primary preadipocytes from mice. F, qRT-PCR analysis of baseline NRG1 expression in primary preadipocytes and primary preadipocyte-derived adipocytes. Three biological replicates were performed. Expression levels are normalized to GAPDH. Data are represented as mean ± SD. G, Western blot analysis of pHER3 and pAKT in RT4 and RT112 cells treated with CM of 3T3-L1 cells or 3T3-L1-derived adipocytes, or the respective media control. β-Actin served as a loading control. Unpaired t test was used for statistical analysis. ***, P < 0.001; ****, P < 0.0001. (E, Created with BioRender.com.)

NRG1-mediated resistance against erdafitinib is restricted to preadipocytes. A, Representative images showing the adipogenic differentiation of 3T3-L1 cells (preadipocytes) to differentiated adipocytes. The differentiation process was carried out for 7 days. Arrows, formation of lipid droplets in adipocytes. B, Proliferation analysis of RT4 cells treated with 10 nmol/L erdafitinib in media control (ctrl) or CM of adipocytes collected after 7 days of differentiation. Crystal violet staining was performed on day 7. Data were normalized to cells treated with vehicle. Three biological replicates were performed. Data are represented as mean ± SD. C, qRT-PCR analysis of baseline NRG1 expression in 3T3-L1 cells and 3T3-L1-derived adipocytes. Three biological replicates were performed. Expression levels are normalized to GAPDH. Data are represented as mean ± SD. D, Western blot analysis of NRG1 in 3T3-L1 under adipogenic differentiation. β-Actin served as a loading control. E, Schematic illustration of the process of isolating primary preadipocytes from mice. F, qRT-PCR analysis of baseline NRG1 expression in primary preadipocytes and primary preadipocyte-derived adipocytes. Three biological replicates were performed. Expression levels are normalized to GAPDH. Data are represented as mean ± SD. G, Western blot analysis of pHER3 and pAKT in RT4 and RT112 cells treated with CM of 3T3-L1 cells or 3T3-L1-derived adipocytes, or the respective media control. β-Actin served as a loading control. Unpaired t test was used for statistical analysis. ***, P < 0.001; ****, P < 0.0001. (E, Created with BioRender.com.)