Figure 2.

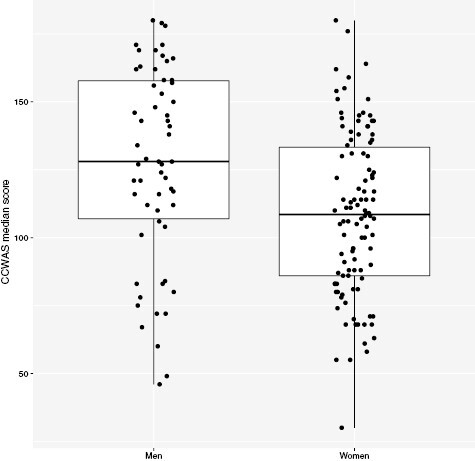
Boxplots demonstrating distributions of CCWAS total combined scores according to gender of respondents. Box limits indicate the range of the central 50% of the data, with a central line marking the median value.

Boxplots demonstrating distributions of CCWAS total combined scores according to gender of respondents. Box limits indicate the range of the central 50% of the data, with a central line marking the median value.