
Figure 6.
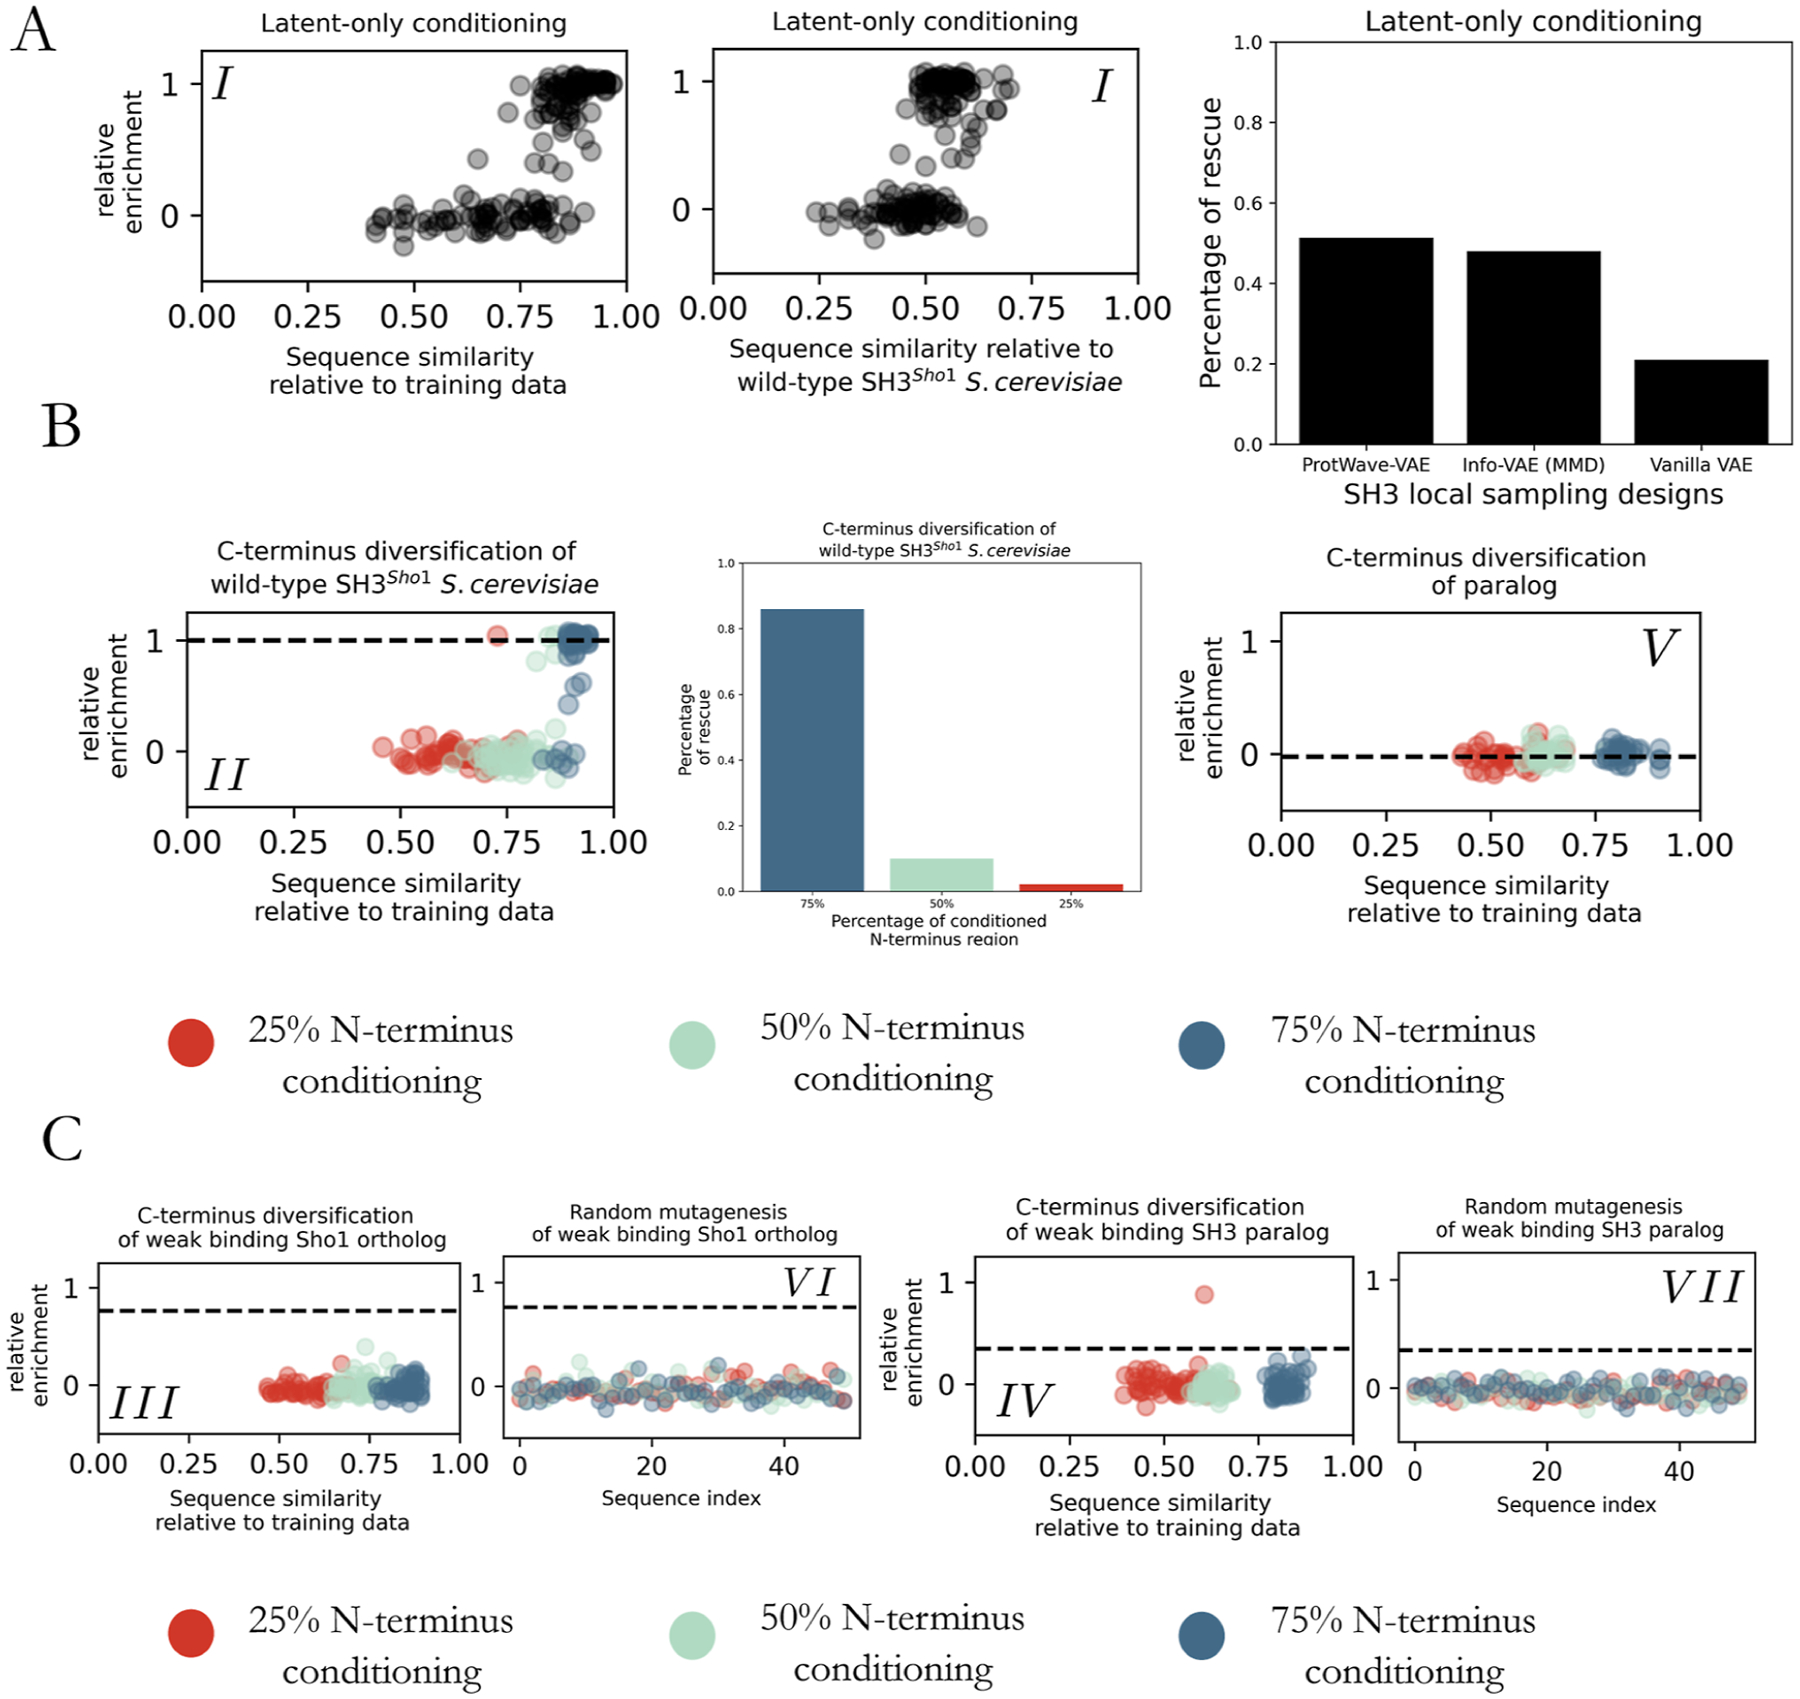
Experimental outcomes of ProtWave-VAE generated sequences. (A) Subgroup (I)—latent-only synthetic design. Scatterplots illustrate the sequence similarity measured by normalized Levenshtein distance and relative enrichment (r.e.) scores for the synthetic designs. The bar graph demonstrates the ProtWave-VAE performance through local sampling compared to the synthetic generative designs previously reported for our VAE-based DGM using an Info-VAE employing a max-mean discrepancy (MMD) loss and a Vanilla VAE employing the standard ELBO loss.14 The ProtWave-VAE generates diverse sequences with a high probability of functional rescue. (B) Subgroups (II)—maintaining function with C-terminus diversification for SH3 wild-type—and (V)—elevating function of a nonfunctional paralogue using C-terminus diversification. Experimental measurements for design groups employed 25% (red), 50% (green), and 75% (blue) of the sequence length for N-terminal conditioning. The scatterplot on the left displays the r.e. scores for subgroup (II) versus sequence similarity to the training data set. The bar graph reveals the rescue percentage within the design pool for subgroup (II) at varying N-terminus conditioned percentages. The scatterplot on the right presents r.e. vs sequence similarity to the training data set for subgroup (V). None of these sequences rescued the osmosensing function. The horizontal dotted line for both scatterplots corresponds to the relative enrichment score of the homologue used for N-terminus conditioning. (C) Subgroups (III) and (VI)—elevating function of a weak binding Sho1 orthologue using C-terminus diversification and its random mutagenized control—and (IV) and (VII)—elevating function of a partial rescuing SH3 paralogue using C-terminus diversification and its random mutagenized control. The two left scatterplots pertaining to subgroups (III) and (VI) failed to show any rescue at any level of N-terminal conditioning. The two right scatterplots pertaining to subgroups (IV) and (VII) show that one of the generatively designed sequences with 25% N-terminal conditioning did rescue function.