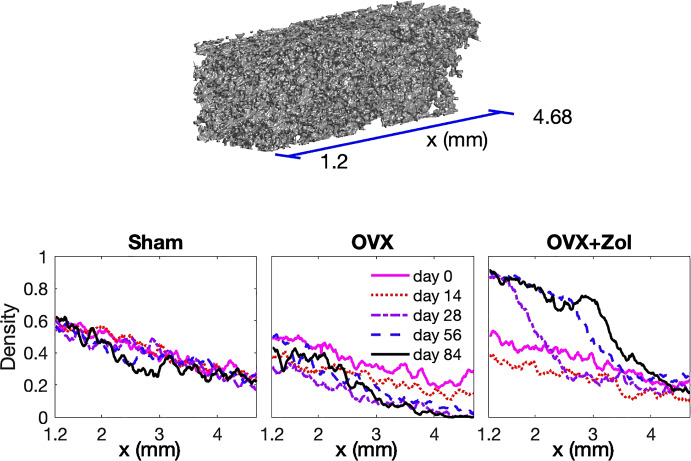
Fig. 2.
Data block and density plots. The top panel shows an example of a 3D data block from a CT reconstruction of the region of a tibia indicated by the 2D sketch in Fig. 1. This example is from an OVX rat at day 14. The density of the trabecular bone is higher near the growth plate (near ) than farther from the growth plate (near ). Each of the three lower panels show plots of density, , as a function of x for a single rat selected from the indicated group at the five time points (days). The horizontal axis is x, the distance from the growth plate, and matches the axis shown in the top panel in this figure and the x-axis in Fig. 1

