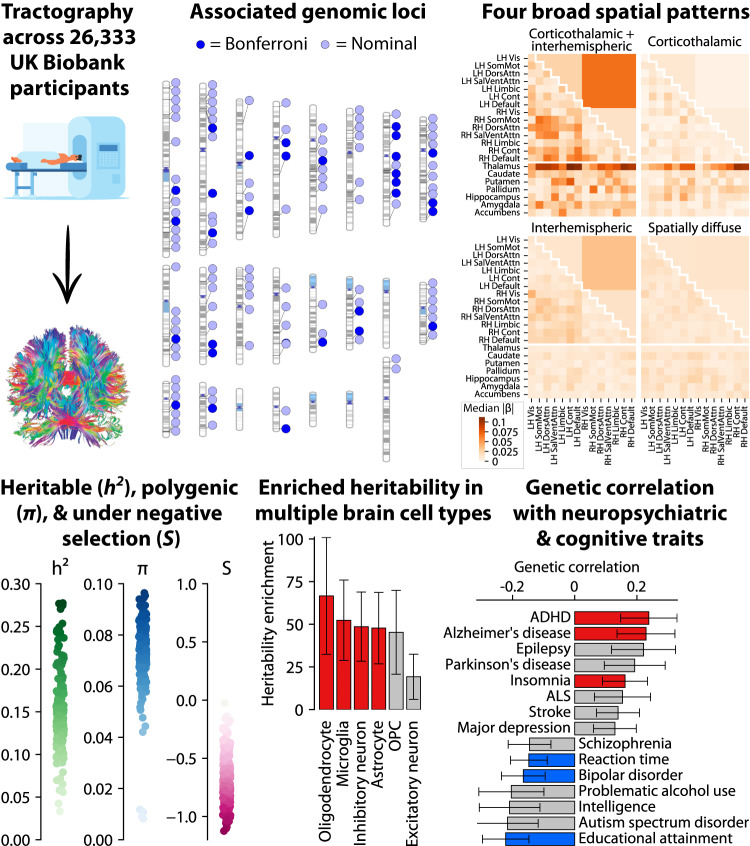
Fig. 1. Study overview.
Top left: Measurement of tractograms from participants with brain imaging data in the UK Biobank. Top middle: genomic locations of common genetic variants associated with structural connectivity, with chromosomes in ascending order (first row: chr1-8; second row: chr9-16; third row: chr17-22 and chrX). 30 independent variants were genome-wide significant after Bonferroni correction for the 206 structural connectivity measures studied (dark blue), and 96 more reached nominal genome-wide significance (light blue). Top right: the 30 variants cluster into four broad patterns of spatial association: corticothalamic and interhemispheric (3 variants), corticothalamic only (1 variant), interhemispheric only (8 variants), and spatially diffuse (18 variants). Heatmaps denote the median effect size magnitude (|β | ) of variants with each pattern on each of the 206 structural connectivity measures. Bottom left: heritability (h2), polygenicity (π), and selection parameter (S) for each of the 206 measures. Bottom middle and right: heritability enrichments for regions with increased chromatin accessibility in each of 6 adult brain cell types, and genetic correlations with 15 brain-related traits. Bars show maximums across the 206 measures; red/blue bars are significant after Bonferroni correction. OPC oligodendrocyte progenitor cell, ADHD attention-deficit/hyperactivity disorder, ALS amyotrophic lateral sclerosis, disord. disorder. Error bars represent 95% confidence intervals.

