Fig. 4.
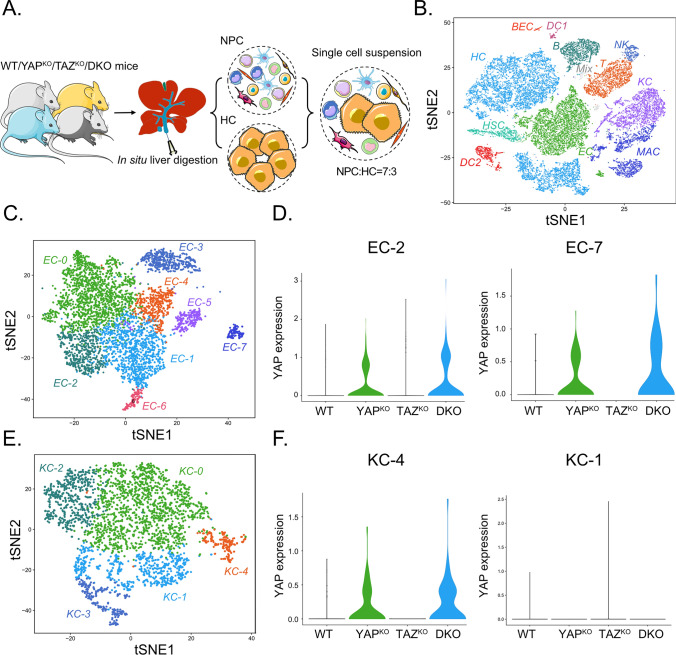
scRNA-seq reveals YAP induction in EC and KC subclusters. A Scheme illustrating the experimental setup. Livers from WT, YAPKO, TAZKO, and DKO mice were digested in situ to achieve pure and viable murine HCs (20–30 µm), smaller NPCs, and infiltrating immune cells. Cell fractions were mixed at a ratio of 7:3 and applied to the 10x scRNA-seq platform. Figure 4A was modified using Servier Medical Art (http://smart.servier.com). B T-distributed stochastic neighbor embedding (t-SNE) plot showing annotated and color-coded cell types derived from WT, YAPKO, TAZKO, and DKO livers. HC hepatocytes, HSC hepatic stellate cells, NK natural killer cells, B B cells, MAC macrophages, DC1 dendritic cells cluster 1, BEC biliary epithelial cells, EC endothelial cells, KC Kupffer cells, DC2 dendritic cells cluster 2, Mix cells not expressing distinct marker genes. C t-SNE plot illustrating eight subtypes of ECs. The different EC subclusters are characterized by specific marker genes and cellular processes such as EC-0 (CDH13, WNT2, KIT, PLPP1 representing pericentral ECs) and EC-1/EC-6 (EFNB1, LTBP4, LY6A, NTN4, representing periportal ECs). D Violin plot showing YAP induction in the subclusters EC-2 and EC-7 from YAPKO and DKO animals but not WT and TAZKO mice. Other EC subclusters did not show a comparable YAP expression pattern. E t-SNE plot illustrating five subtypes of KCs. The different KC subclusters are characterized by specific marker genes and cellular processes, such as KC-0 (M1 polarization-like phenotype) and KC-1 (lipid metabolism). F Violin plot for subcluster KC-4 demonstrating the induction of YAP in liver tissues from YAPKO and DKO mice. Other KC subclusters did not show a comparable YAP pattern (exemplified for KC-1)

