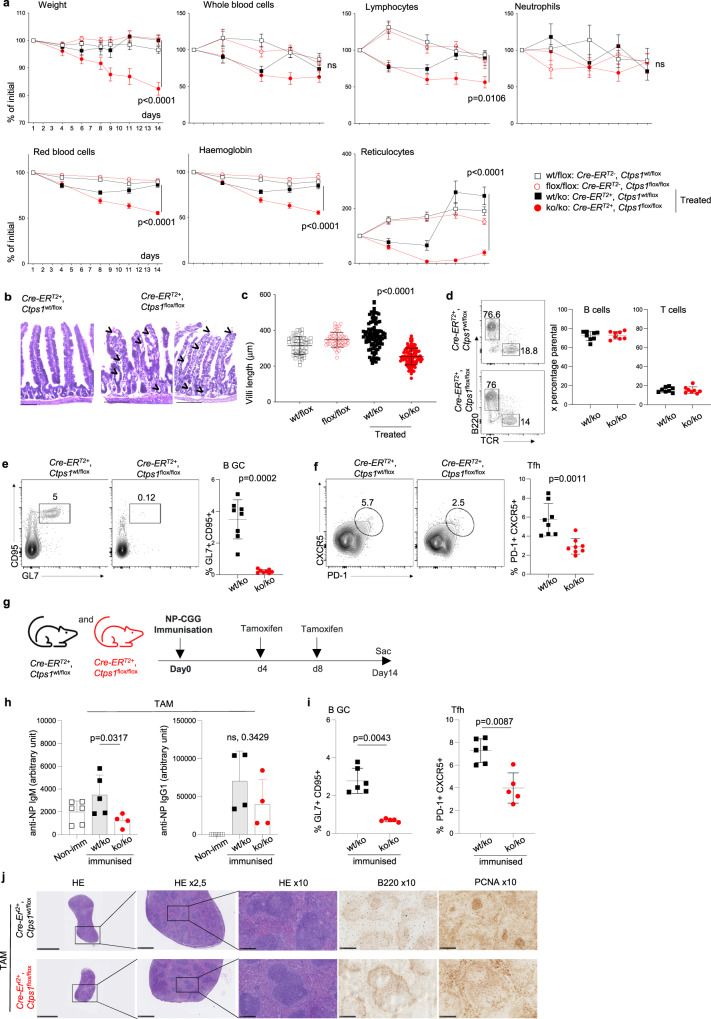
Fig. 2. Inducible CTPS1 deficiency impairs highly proliferating tissues.
a–f Analysis of Cre-ERT2; Ctps1wt/flox and Cre-ERT2; Ctps1flox/flox animals fed with vehicle (Ctps1wt/flox and Ctps1flox/flox or tamoxifen to induce Ctps1) gene inactivation (Ctps1wt/ko and Ctps1ko/ko). a Weights and blood parameters (whole blood cells, lymphocytes, neutrophils, red blood cells, haemoglobin, and reticulocytes) of animals from day 1 of tamoxifen treatment to day 14. Values are expressed as percentage of the initial population counts at day 0. b Representative microscopy images of haematoxylin-eosin coloration of small intestine from tamoxifen treated Ctps1wt/ko and Ctps1ko/ko. Images are representatives of four animals per group. Black arrowhead highlights abnormal features (Scale bars = 100 µm). c Intestinal villi length of non-treated Ctps1wt/flox, Ctps1flox/flox, and tamoxifen treated Ctps1wt/ko and Ctps1ko/ko animals measured at day 14. d-f Analysis of Peyer patches from the intestine. Left panels of representative dot-plots from FACS analysis stained with (d) anti-B220 and anti-TCR antibodies, (e) anti-CD95 and anti-GL7 or (f) anti-CXCR5 and PD-1. Right panels of percentages of B cells and T cells (d), germinal centre (GC) B cells (e) and T follicular helper cells (Tfh) (f) from dot-plots. g–j Cre-ERT2; Ctps1wt/flox or Cre-ERT2; Ctps1flox/flox were immunised with NP-CGG at day 0 and then treated with tamoxifen at day 4 and 8 to induce Ctps1 deletion. g Experimental design. h NP-specific IgM (left), and IgG1 (right) from non-immunised (Non imm.) animals and immunised Ctps1wt/ko and Ctps1ko/ko were quantified by ELISA (arbitrary unit). i Percentages of germinal centre (GC) B cells, anti-CD95 and anti-GL7 (left) and T follicular helper cells (Tfh), anti-CXCR5 and PD-1 (right) obtained from dot-plots of Ctps1wt/ko and Ctps1ko/ko. j Representative microscopy images of haematoxylin-eosin coloration, B220 and PCNA labelling of spleen from tamoxifen treated Cre-ERT2; Ctps1wt/flox and Cre-ERT2; Ctps1flox/flox. Images are representatives of three animals per group. (Scale bars from left to right: 5 mm, 1 mm and 250 µm). Two-way ANOVA with error bar representing mean ± SEM of n = 10 (wt/flox), n = 9 (flox/flox), n = 17 (wt/ko) and n = 14 (ko/ko) animals per group (a). Unpaired t-tests two-tailed with error bar representing mean ± SD; measurement of 100 villi length (c). Data are presented as the mean ± SD of n = 8 (wt/ko) and n = 8 (ko/ko) (d). e–h Non-parametric Matt-Whitney two-tailed test were used. Data are presented as the mean ± SD of n = 8 animals per group (e, f). Data are presented as mean with ± SD of n = 6 (non-immunised); n = 5 (wt/ko) and n = 6 (ko/ko) animals per group (h) and data are presented as the mean ± SD of n = 5 (wt/ko) and n = 6 (ko/ko) (i). Source data are provided in Source Data file.

