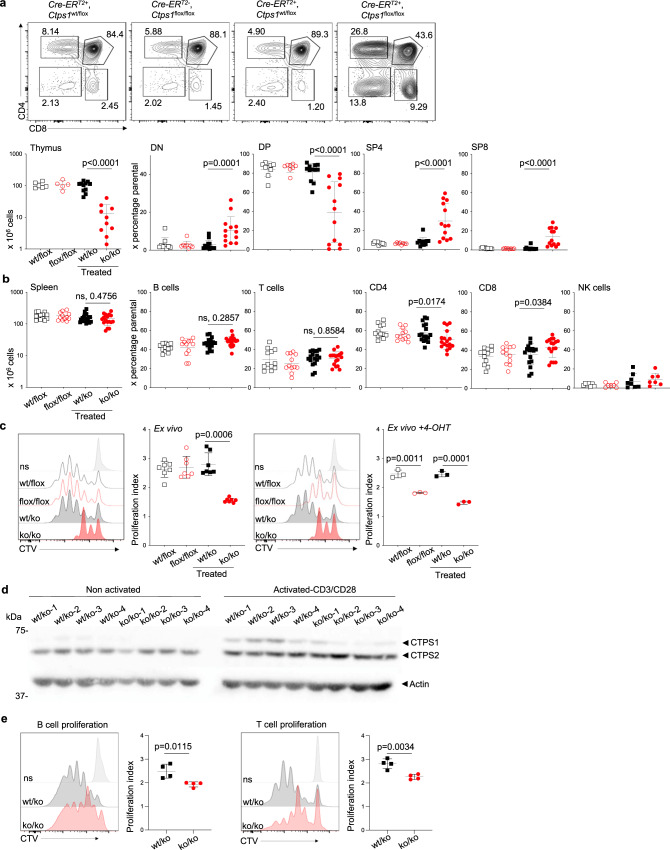
Fig. 3. Inducible CTPS1 deficiency impairs thymic development and proliferation.
a–e Analysis of thymocytes and splenocytes Cre-ERT2; Ctps1wt/flox and Cre-ERT2; Ctps1flox/flox animals fed with vehicle (Ctps1wt/flox and Ctps1flox/flox) or tamoxifen to induce Ctps1 gene inactivation (Ctps1wt/ko and Ctps1ko/ko). a Upper panels corresponding to representative dot-plots from FACS analysis of thymocytes for CD4 and CD8 expression. Lower panels showing total thymus cell counts and percentages of double negative CD4 and CD8 (DN), double positive CD4 and CD8 (DP), single positive CD4 (SP4) and single positive CD8 (SP8) thymocytes from FACS analyses. b Spleen cell counts (left panel) and percentages of splenic B, T, CD4, CD8 and NK cells calculated from FACS analyses. c Representative proliferation histogram profiles from FACS analysis of enriched spleen T cells labelled with cell trace violet (CTV) and activated ex vivo after tamoxifen treatment, with anti-CD3/CD28 beads plus IL-2 for 3 days. Graph bars (right panel) corresponding to proliferation indexes calculated from histogram profiles (left panels). On the right panels, same as left but 4-hydroxy tamoxifen was extemporary added to the ex vitro culture of spleen T cells (right panels). d Immunoblots for CTPS1, CTPS2 and Actin expression in lysates of non-activated or activated T cells at the day of sacrifice. Four treated Ctps1wt/ko and Ctps1ko/ko animals were analysed. Blot is the pool of two independent experiments. Molecular weights in kDa on the left. e B and T cells were sorted from total spleen of Ctps1wt/ko and Ctps1ko/ko mice. Both T and B were labelled with CTV. B-cell proliferation was induced by stimulation with LPS and IL-4 for 3 days, while T cell proliferation was induced by anti-CD3/CD28 beads plus IL-2 for 3 days. Graph bars (right panels) corresponding to proliferation indexes calculated from histogram profiles. Non-parametric Matt-Whitney two-tailed test (a–c left) and unpaired two-tailed t-tests (c right and e) were used. Data are presented as the mean ± SD of n = 9 (wt/flox), n = 8 (flox/flox), n = 12 (wt/ko) and n = 13 (ko/ko) animals per group (a), of n = 12 (wt/flox), n = 12 (flox/flox), n = 17 (wt/ko) and n = 17 (ko/ko) animals per group (b), of n = 7 per group (c-left) and of n = 4 animals per group (c right and e). Source data are provided in Source Data file.

