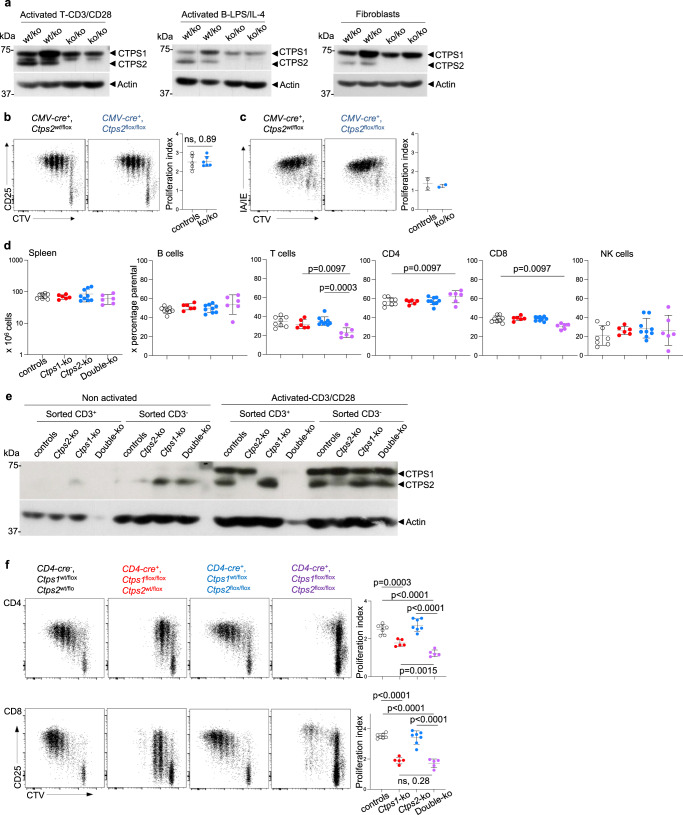
Fig. 6. Partial redundancy of CTPS1 and CTPS2 in proliferation of activated T cells.
a–c Analyses of T and B lymphocytes of CMV-Cre; Ctps2flox/flox (Ctps2ko/ko) and control littermate (Ctps2wt/flox, Ctps2flox/flox and Ctps2wt/ko) animals. a, b Analysis of splenic enriched T cells activated by anti-CD3/CD28 plus IL-2 for 3 days. a, c Analysis splenic purified B cells activated with LPS plus IL-4 for 3 days. a Immunoblots for CTPS1, CTPS2 and Actin expression in lysates of activated T cells (left panel), activated B cells (central panel) and fibroblasts recovered from ear skin (right panel). Molecular weights in kDa on the left. Blots represent two pooled, independent experiments. b Representative proliferation dot plot profiles (left panels) from FACS analysis of enriched T cells labelled with cell trace violet (CTV) and stained for CD25, as an activation marker. Graph bars (right panels) corresponding to proliferation indexes calculated from histogram profiles. c Representative proliferation dot plot profiles (left panels) from FACS analysis of B cells labelled with cell trace violet (CTV) and stained for IA/IE, as an activation marker. Graph bars (right panels) corresponding to proliferation indexes calculated from histogram profiles. d–f Analysis of from CD4-Cre; Ctps1wt/floxxCtps2wt/flox (Ctps1wt/ko, Ctps2wt/ko) empty black circle, CD4-Cre; Ctps1flox/floxxCtps2wt/flox (Ctps1ko/ko, Ctps2wt/ko) filled red circle, CD4-Cre; Ctps1wt/floxxCtps2flox/flox (Ctps1wt/ko, Ctps2ko/ko) filled blue circle and CD4-Cre; Ctps1flox/floxxCtps2flox/flox (Ctps1ko/ko, Ctps2ko/ko) filled purple circle. d Spleen cell counts (left panel) and percentages of splenic B, T, CD4+, CD8+ and NK cells calculated from FACS analyses. e Immunoblots for CTPS1, CTPS2 and Actin protein expression in lysates from non-activated or activated splenic T cells, sorted and non-sorted on CD3+. Molecular weights in kDa on the left. Blot is representative of two independent experiments. f Representative proliferation dot plot profiles (right panels) from FACS analysis of CD4+ (upper panels) and CD8+ (lower panels) T cells labelled with cell trace violet (CTV) and stained for CD25 as an activation marker. Graph bars (right panels) corresponding to proliferation indexes calculated from histogram profiles. Non-parametric Matt-Whitney two-tailed test (b) and Unpaired t-tests two-tailed (d, f) were used. Data are presented as the mean ± SD of n = 5 animals per group (b), of n = 8 (controls), n = 6 (Ctps1ko), n = 9 (Ctps2ko) and n = 6 (DKO) animals per group (d) and of n = 7 (controls), n = 5 (Ctps1ko), n = 7 (Ctps2ko) and n = 5 (DKO) animals per group (f). Source data are provided in Source Data file.

