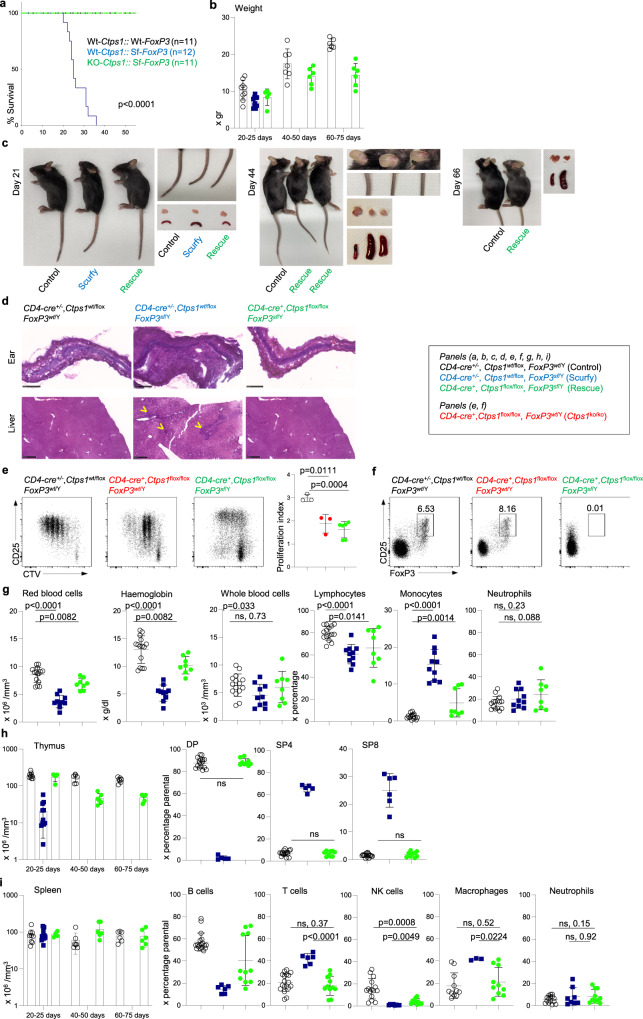
Fig. 7. Inactivation of Ctps1 in T cells in Scurfy (FoxP3sf/Y) animals relieves autoimmune and inflammatory symptoms.
a-i Analyses of CD4-Cre; Ctps1wt/floxxFoxP3wt/Y (Ctps1wt/ko-FoxP3wt/Y) CD4-Cre; Ctps1wt/floxxFoxP3sf/Y (Ctps1wt/ko-FoxP3sf/Y) and CD4-Cre; Ctps1flox/floxxFoxP3sf/Y (Ctps1ko/ko-FoxP3sf/Y). a Kaplan Meier survival curves. b Animal weights measured at different days as indicated. c Macroscopic views of Ctps1wt/ko-FoxP3wt/Y, Ctps1wt/ko-FoxP3sf/Y and Ctps1ko/ko-FoxP3sf/Y animals and organs. Tail, thymus, and spleen at day 21 (top), day 44 (middle) and day 66 (bottom). Ears also shown at day 44. d Representative microscopy images of haematoxylin-eosin coloration of ear and liver at day 21. Infiltration highlighted with yellow arrowheads. Images are representatives of four animals per group. (Scale bars 250 µm). e Representative proliferation dot plot profiles (right panels) from FACS analysis of splenic T cells from animals from day 25 labelled with cell trace violet (CTV), stained for CD25 as an activation marker and activated by anti-CD3/CD28 plus IL-2 for 3 days. Graphs (right panel) corresponding to proliferation indexes calculated from histogram profiles. f Dot-plots from FACS analysis of FoxP3 intracellular staining on splenic T cells from the same animals as in (e). Numbers in the gates correspond to proportions or graph bars of CD4+CD25+FoxP3+. Gates defined based on staining with control Ig isotypes. g–i Analyses of haematological and immunological parameters. g Red blood cells, haemoglobin levels, whole blood cells numbers and proportions of lymphocytes, monocytes and neutrophils in blood, analysed from day 18–50. h Graph bars showing total thymus cell counts (left panel) at different periods of time as indicated. Proportions (right panels) from FACS analysis of double positive CD4 and CD8 (DP), single positive CD4 (SP4) and single positive CD8 (SP8) thymocytes. i Graph bars showing total spleen cell counts (left panel) and proportions of splenic B, T, NK cells, macrophages and neutrophils (right panels) from FACS analysis. A Log-rank (Mantel-Cox) statistical test for curve comparison was used: n = 11 (control), n = 12 (scurfy) and n = 11 (rescue) (a). Data are from n = 9 (control), n = 10 (scurfy) and n = 6 (rescue) animals per group (b). Unpaired t-tests two-tailed were used (e, g–i). Data are presented as the mean ± SD of n = 3 (control), n = 3 (scurfy) and n = 6 (rescue) (e), of n = 15 (control), n = 10 (scurfy) and n = 8 (rescue) (g), of n = 17 (control), n = 5 (scurfy) and n = 9 (rescue) (h), and of n = 18 (control), n = 6 (scurfy) and n = 11 (rescue) (i). Source data are provided in Source Data file.

