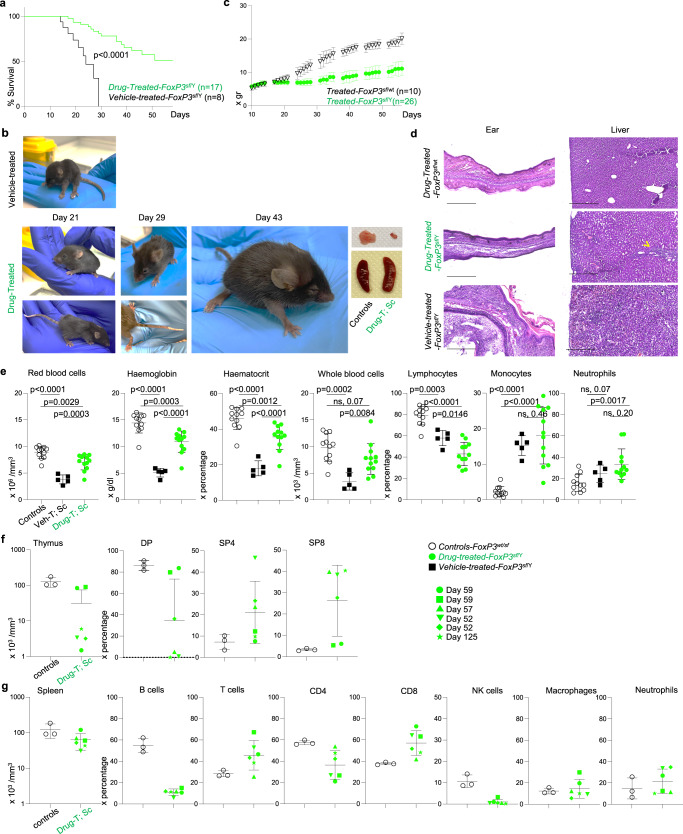
Fig. 8. Decreased pathological symptoms and survival of FoxP3sf/Y animals upon treatment with an inhibitor of CPTPS1.
a–d Analyses of FoxP3sf/Y vehicle-treated animals (black) or with an inhibitor of Ctps1 (green) with drug-treated littermate female FoxP3wt/sf animals as controls (white). a Kaplan Meier survival curves. b Weights of animals from day 10 and every two-three day along the life of animals of vehicle-treated littermate females FoxP3wt/sf and males FoxP3sf/Y treated with the inhibitor of Ctps1. c Macroscopic view of FoxP3sf/Y animals at day 21 and FoxP3sf/Y treated with the Ctps1 inhibitor at day 21, 29 and 43. Thymus, and spleen are shown at day 43. d Representative microscopy images of haematoxylin-eosin coloration of ear and liver at day 52. Images are representatives of three animals per group. (Scale bars 500 µm). e–g Analyses of haematological and immunological parameters. e Red blood cells, haemoglobin levels, haematocrit percentage, whole blood cells numbers and proportions of lymphocytes, monocytes and neutrophils in blood. f Graph bars showing total thymus cell counts (left panel) and proportions (right panels) from FACS analysis of double positive CD4 and CD8 (DP); single positive CD4 (SP4) and single positive CD8 (SP8) thymocytes. g Graph bars showing total spleen cell counts (left panel) and proportions of splenic B, T, CD4+, CD8+, NK cells, macrophages and neutrophils cells (right panels) from FACS analysis. A Log-rank (Mantel-Cox) statistical test for curve comparison was used: n = 8 (vehicle-treated), n = 17 (drug-treated) (a). Data are from n = 10 (female, drug-treated), n = 26 (male, drug-treated) animals per group (c). Unpaired two-tailed t tests were used (e, f–g). Data are presented as the mean ± SD of n = 11 (control), n = 3 (vehicle-treated), n = 12 (drug-treated) (e), of n = 3 (control) and n = 6 (rescue) (f–g). Source data are provided in Source Data file.

