Figure 1.
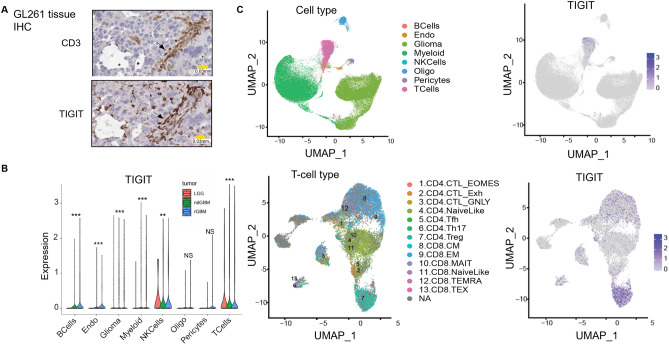
TIGIT is expressed on T-cells and Natural Killer cells in GBM. Histological (A) and scRNAseq (B,C) analyses and assessment of TIGIT expression in murine and patient derived GBM tissues. (A) IHC staining of CD3 (left) and TIGIT (right) expression on murine GL261 tissue extracted from 2-week tumor mice. (B) Violin plots visualizing TIGIT expression in all glioma cell types among patients with low-grade glioma (LGG), newly diagnosed high-grade glioma (ndGBM), and recurrent high-grade glioma (rGBM); ** denotes p value ≤ 0.01, *** ≤ 0.001 (C). Color-coded clustered UMAPs visualizing TIGIT expression in all patient GBM cell types.

