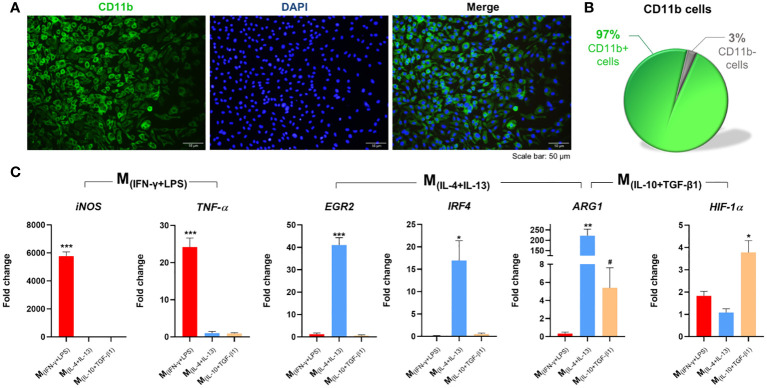
Figure 1.
Isolation, differentiation, and polarization of macrophages. (A) Splenic monocytes cultured with macrophage colony-stimulating factor (M-CSF) for 7 days differentiated into macrophages; (B) with a culture purity of 97%. (C) Macrophages stimulated for 6 h with INF-γ and LPS significantly overexpressed iNOS (2, 7 df, p<0.0001) and TNF-α (2, 7 df, p<0.0001). Macrophages stimulated with IL-4 and IL-13 significantly overexpressed EGR2 (2, 6 df, p<0.0001), IRF4 (2, 6 df, p=0.0216), and Arg-1 (p=0.0020); and Macrophages stimulated with IL-10 and TGF-β1 significantly overexpressed ARG1 (p=0.0357), and HIF-1α.(2, 8 df, p=0.0032). Target genes were normalized to three reference genes: GADPH, HPRT and 18s. Fold-change levels were calculated by the 2-ΔΔct method related to non-stimulated macrophages. In immunocytochemistry photomicrographs macrophages were quantified using the anti-CD11b antibody (green) and nuclei were stained with DAPI (blue). One Way ANOVA followed with Tukey post-hoc test was used for statistical analysis. Arg-1 data were analyzed using the Mann Whitney test because normality was not achieved using the Shapiro-Wilk test. Data is presented as mean ± standard error (SEM). df= degrees of freedom, * or #- p< 0.05; **- p< 0.01; ***- p< 0.001. Scale bar =50 µm. n=3. 2 independent experiments were performed.

