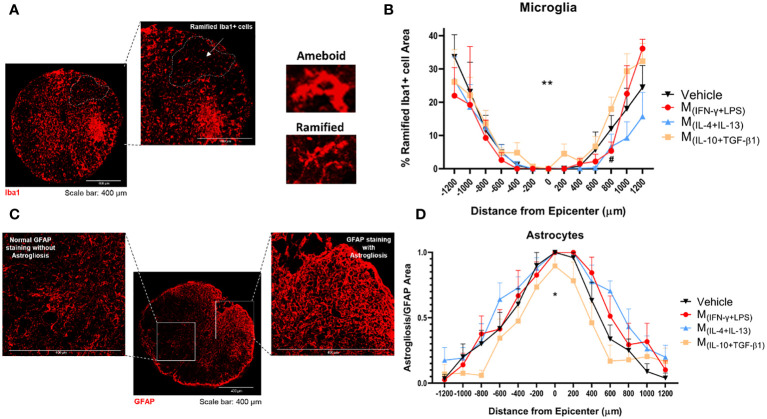
Figure 7.
Histological analysis of the spinal cord 38 dpi. (A) Representative image of microglia from M(IL-10+TGF-β1)-treated group, cells were stained using the antibody anti-IBA1 (red) and the area of the ramified microglia was analyzed. (B) Rostral-caudal analysis demonstrated that the animals treated with M(IL-10+TGF-β1)-derived secretome presented overall significantly more ramified microglia than M(IL-4+IL-13) group (3, 239 df, p=0.0058) and presented more ramified microglia than the M(INF-γ+LPS) group at 800 µm caudal to the injury (3, 239 df, p=0.0469). (C) Representative image of astrocytes from vehicle-treated group, cells were stained with anti-GFAP antibody (red) and astrogliosis were analyzed by quantification of the area of clustered GFAP overstaining (areas impossible to distinguish individual astrocytes). (D) Rostral-caudal analysis demonstrated that mice treated with M(IL-10+TGF-β1)-derived secretome had significantly less astrogliosis than the animals treated with M(IL-4+IL-13) or M(INF-γ+LPS) secretome (3, 231 df p<0.0001). Differences in both microglia and astrocytes analysis were detected using two-way ANOVA followed by Tukey’s multiple comparisons test. A total of 284 spinal cord slices were observed to analyze astrogliosis and 301 slices to microglia. Data is presented as mean ± standard error (SEM). * or #- p< 0.05; **- p< 0.01; Vehicle n=7; M(INF-γ+LPS) n=6; M(IL-4+IL-13) n=8; M(IL-10+TGF-β1) n=6. 1 independent experiment was performed.

