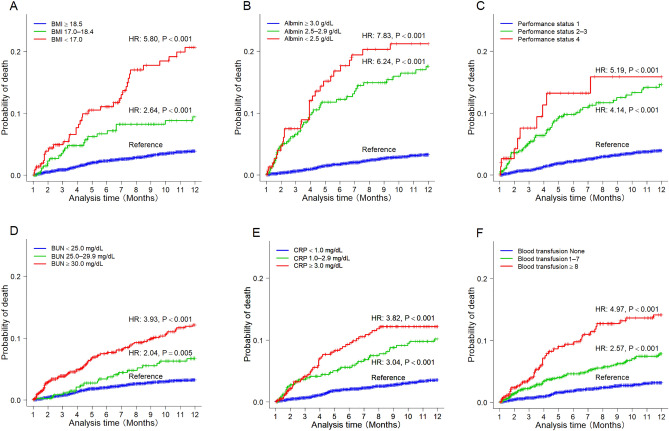
Figure 4.
Cumulative probability of mortality according to risk factors using the Kaplan–Meier method. (A) BMI (< 17.0, 17.0–18.4, and ≥ 18.5). (B) Albumin level (< 2.5, 2.5–2.9, and ≥ 3.0 g/dL). (C) Performance status (1, 2–3, and 4). (D) BUN (< 25.0, 25.0–29.9, and > 30.0 mg/dL). (E) CRP (< 1.0, 1.0–2.9, and ≥ 3.0 mg/dL). (F) Amount of blood transfusion (none, 1–7 units, and ≥ 8 units). P values were calculated using the Cox proportional hazards model. BMI body mass index, BUN blood urea nitrogen, CRP C-reactive protein.

