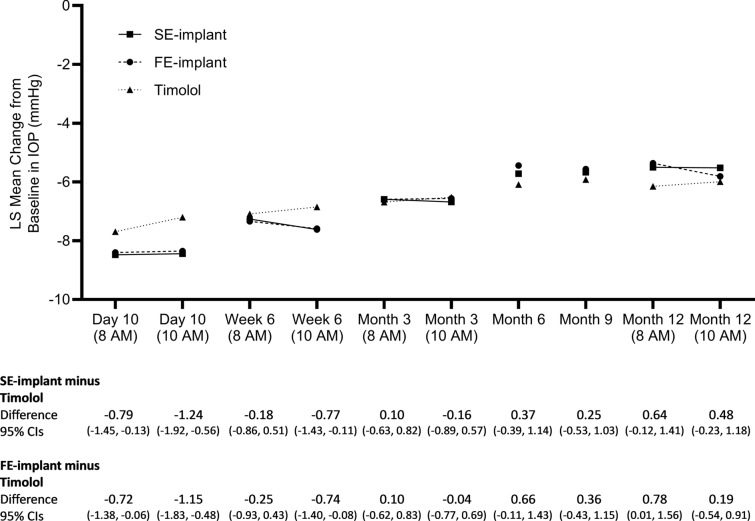
Fig. 2.
LS mean change from baseline in IOP at the 8 a.m. and 10 a.m. measurement timepoints at day 10, week 6, month 3 and month 12, and at the 8 a.m., 10 a.m., or 4 p.m. measurement timepoint at month 6 and 9. Data below the plot indicate the LS means difference and upper and lower 95% CIs in the IOP change from baseline (in mmHg) between the implant group and the timolol group at each timepoint and visit. CIs confidence intervals, FE-implant fast-eluting travoprost intracameral implant, IOP intraocular pressure, LS mean least squares mean, SE-implant slow-eluting travoprost intracameral implant

