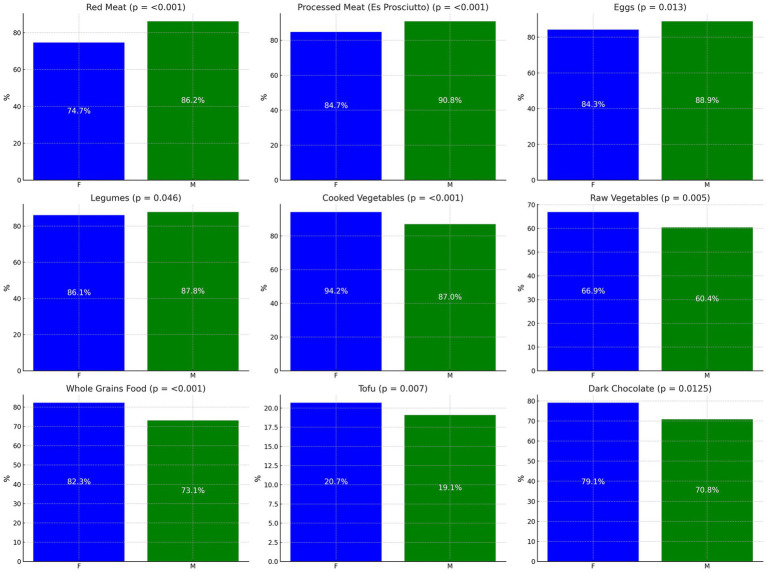
Figure 2.
Comparative analysis of food preferences by gender. Comparative prevalence of ‘Yes’ responses indicating a preference for selected food items, distributed by gender. Percentages represent the proportion of respondents within each gender who favored the food item. p-values are indicated for each item. Statistical test: chi-square test.

