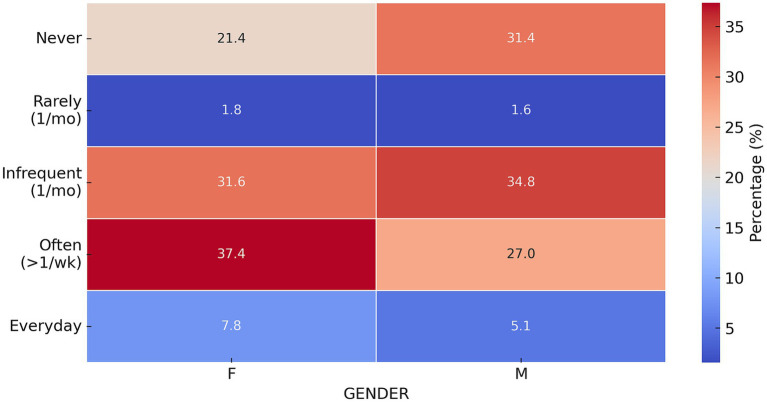
Figure 5.
Normalized distribution of responses to the question “Do you happen to eat uncontrollably even if you’re not hungry?” by gender. Heatmap illustrating the normalized distribution of responses to the question “Do you happen to eat uncontrollably even if you are not hungry?” The responses are categorized by gender. The color gradient represents the percentage of respondents in each category, with annotations indicating the exact percentage. Statistical test: chi-square test, p < 0.001.

