editorial
. 2024 Feb 21;25(3):314–318. doi: 10.3348/kjr.2023.1142

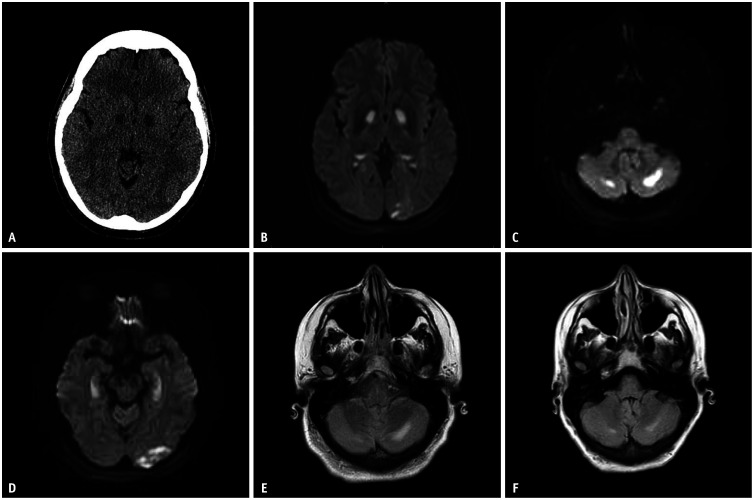
Fig. 2. Selective images from Case 2. A: Initial head CT depicts bilateral basal ganglia hypodensities. B-D: Subsequent MRI DWI images on the following day reveal restricted diffusion in the bilateral basal ganglia, with asymmetric restricted diffusion in the left occipital lobe (B), bilateral cerebellar hemispheres (C), and bilateral hippocampi (D). E, F: There is a bilateral increased FLAIR signal in the cerebellar hemispheres (E), which shows partial resolution on follow up MRI two weeks later (F). CT = computed tomography, MRI = magnetic resonance imaging, DWI = diffusion-weighted imaging, FLAIR = fluid attenuated inversion recovery.

Fig. 2