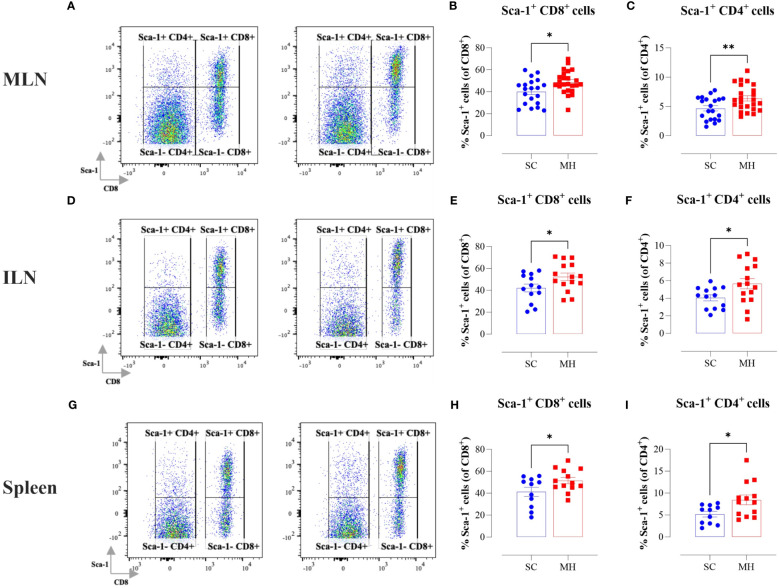
Figure 1.
Lymphocyte activation in lymphoid tissues following MH treatment. BALB/c mice were orally gavaged with either SC or MH for 4 weeks. Following treatment, lymphoid organs were processed for flow cytometry analysis. Cells from MLNs (A–C), ILNs (D–F), and spleens (G–I) were analyzed to quantify the percentage of Sca-1+ CD8+ T cells (B, E, H), and Sca-1+ CD4+ T cells (C, F, I). Representative dot plots are shown in (A, D, G). The values for individual mice and mean ± SEM are shown. The data is pooled from 5 (A–C), 4 (D–F), and 3 independent experiments (G–I). p values were calculated using the unpaired Student’s t-test, * (p ≤ 0.05), and ** (p ≤ 0.01).

