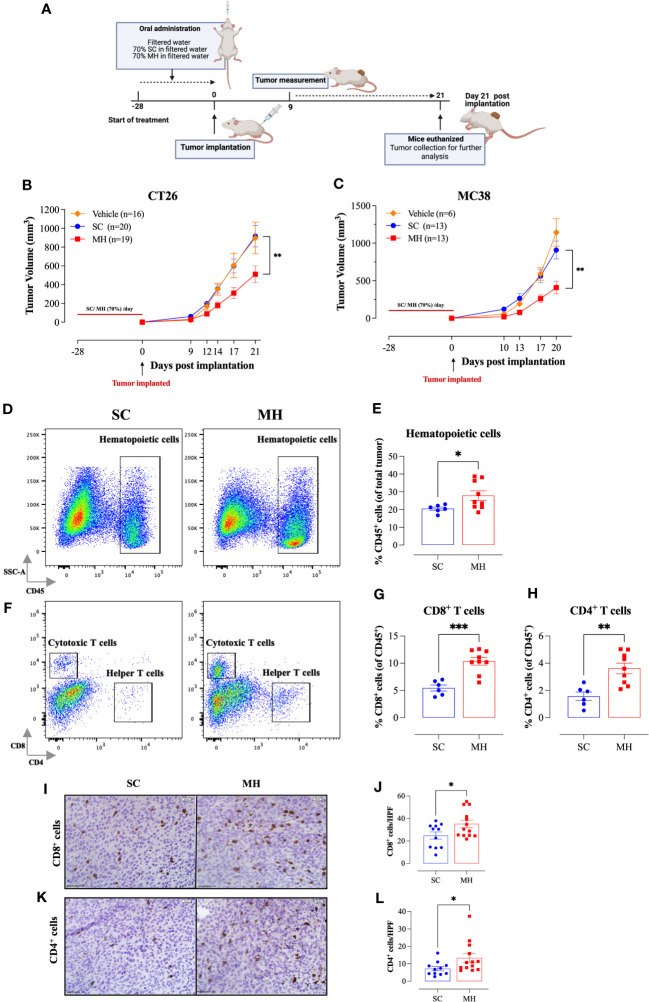
Figure 2.
Retardation of tumor growth in MH pre-treated mice correlates with enhanced tumor infiltration by immune cells. (A) A schematic diagram describing the preventative model treatment protocol. Mice were orally gavaged daily with filtered water, 70% SC or 70% MH for 4 consecutive weeks. Following the treatment period, CT26 or MC38 CRC cells were implanted and tumor growth was followed for the subsequent 3 weeks. Mice were euthanized on day 21 post-implantation, and tumors were excised and processed for further analysis. Tumor growth curves of CT26 (B) or MC38 tumor (C) in water-treated, SC-treated, and MH-treated mice are shown. Each data point represents the mean ± SEM of 16-20 mice, pooled from 3 individual experiments. Asterisks denote statistically significant differences between the SC-treated and MH-treated groups. p values were calculated using 2-way ANOVA. Resected tumors were analyzed for the extent of intratumoral immune cells by flow cytometry (D–H) and immunohistochemistry (I–L). Representative dot plots and quantification of percentage of CD45+ immune cells (D, E), CD8+ cytotoxic T cells (F, G), and CD4+ helper T cells (F, H). The values for individual mice and mean ± SEM are shown (SC: n=6, MH: n=9), pooled from 2 independent experiments. (I–L) Tissue sections were analyzed by immunohistochemistry to quantify the number of CD8+ and CD4+ cells. Representative images at 40× magnification (scale bar 20 μm), and the quantitative estimation of the number of CD8+ cells (I, J) and CD4+ cells (K, L) per HPF (high-power field) are presented for each group. The values for individual mice and mean ± SEM are shown (SC: n=11, MH: n=13), pooled from 3 independent experiments. Asterisks denote statistically significant differences between the MH-treated and SC-treated groups. p values were calculated using the unpaired Student’s t-test, * (p ≤ 0.05), ** (p ≤ 0.01), and *** (p ≤ 0.001).

