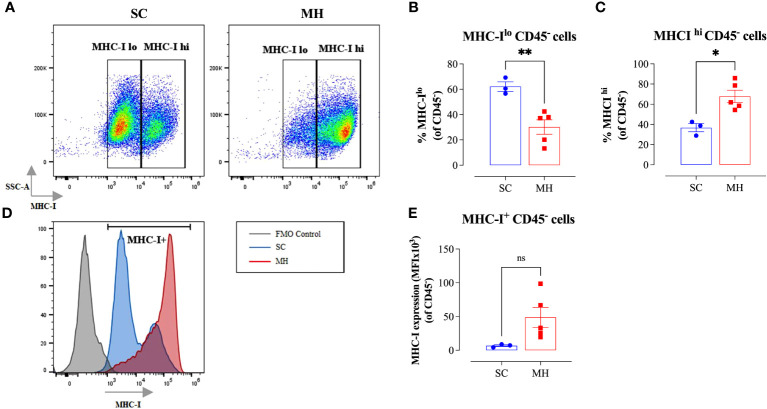
Figure 4.
Enhancement in tumor immunogenicity as a consequence of MH administration. (A–C) Representative flow plots (A) and quantification of the percentage of MHC-Ilo (B) and MHC-Ihi (C) (gated on CD45- cells) in SC-treated and MH-treated mice. (D) Representative overlay histograms showing MHC-I expression on CD45- cells of SC-treated and MH-treated mice. The grey histogram indicates staining with FMO control (E) Median fluorescence intensity of MHC-I+ CD45- cells in SC-treated and MH-treated groups. The values for individual mice and mean ± SEM are shown (SC: n=3, MH: n=5), obtained from 1 experiment. Asterisks denote statistically significant differences between MH-treated and SC-treated groups. p values were calculated using the unpaired Student’s t-test, * (p ≤ 0.05), ** (p ≤ 0.01), and ns (no statistical significance, p > 0.05).

