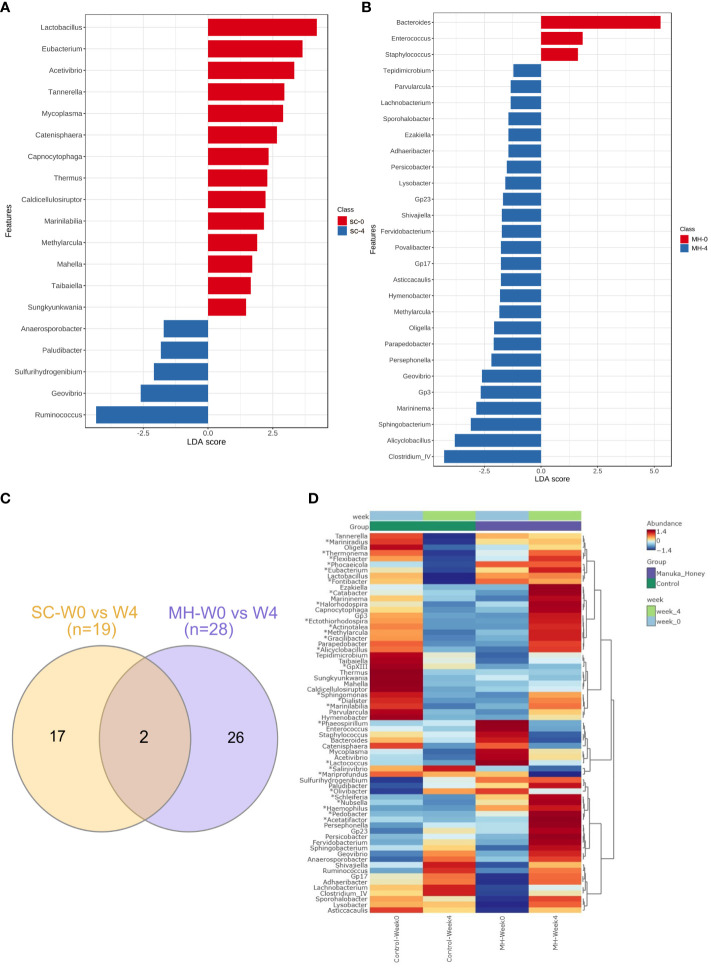
Figure 8.
Microbiota variations after 4-week treatment. LDA analysis comparing genera pre and post-treatment with CS (A) and MH (B) showed depleted (red) and enriched (blue) in week 4 post-treatment. Venn diagram (C) of shared and unique genera that were significantly different pre- and post-treatment for each of the SC and MH groups. The heatmap (D) shows microbiota fingerprints in each group before and after treatment, with significantly altered genera. Asterisks (*) represent genera with significant differences between MH and CS after 4 weeks of treatment, while the rest are those with significant difference in week 0 compared to week 4 in either treatment group.

