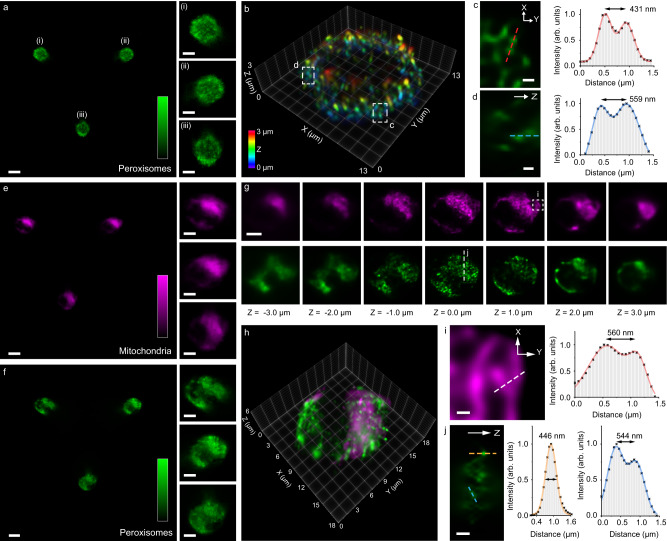
Fig. 3. Imaging peroxisomes and mitochondria in flowing HeLa cells with LFC.
Denoised LFC image (a) and 3D reconstructed volume (b) of peroxisomes in HeLa cells. The LFC image in a is representative of >5 cell images acquired under identical experimental conditions. Insets (i-iii) in (a) show zoomed-in elemental images. Zoomed-in images in X-Y (c) and Z (d) of the corresponding boxed regions in (b), showing nearby peroxisomes resolved as close as 400–600 nm in all three dimensions. Denoised two-color LFC images of mitochondria (e, magenta) and peroxisomes (f, green), their corresponding reconstructed axial stacks (g), and merged 3D image (h) of HeLa cells. Insets in (e) and (f) show the corresponding zoomed-in elemental images. Zoomed-in images in X-Y (i) and Z (j) of the corresponding regions indicated in (g), showing resolved subcellular structures of mitochondria and peroxisomes as close as 400–600 nm in all three dimensions. The LFC images in (e) and (f) are representatives of >100 cell images acquired under identical experimental conditions. Scale bars: 10 μm (a, e, f), 5 μm (a insets, e insets, f insets, g), 500 nm (c, d, i, j). Source data are provided as a Source Data file.

