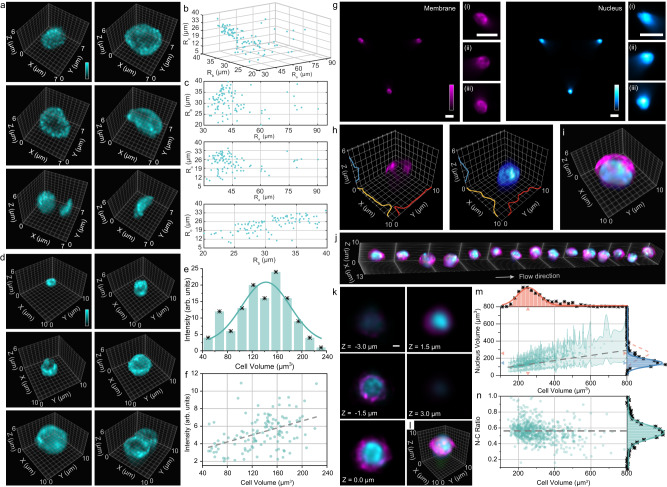
Fig. 4. Comparative analysis of cell morphologies in isolated mouse and human cells.
a 3D reconstructed images displaying a variety of shapes in membrane-labeled mouse blood cells. Ellipsoid-fitted radii of cells Ra, Rb, Rc (Ra > Rb > Rc), viewed in 3D (b) and 2D projections (c), categorizing cells based on their morphologies (n = 188). d 3D reconstructed images displaying a variety of sizes in membrane-labeled mouse spleen cells. e Histogram of cell volumes (n = 113), showing an average cell volume of approximately 140 μm3. f Scatter plot correlating cell fluorescence intensity with cell volumes (n = 125). g Denoised light-field images of the membrane (left) and nucleus (right) of mouse naïve T cells. Corresponding insets show the zoomed-in elemental images. These LFC images are representatives of >5 cell images acquired under identical experimental conditions. 3D reconstructed images of the membrane (h, left) and nucleus (h, right) with intensity profiles along three axes and corresponding two-color overlay (i). j 3D reconstructed volumes of the membrane (magenta)- and nucleus (blue)-labeled human activated T cells in flow. Axial stacks (k) and two-color overlay (l) of a human-activated T cell in (j) across a depth range of 6 μm. m Intensity-to-volume plots for human activated T cells (n = 679), showing mean diameters of 7.99 μm (cell, red) and 6.57 μm (nucleus, blue) through Gaussian fitting and their linear relationship (gray dashed line with green-shaded errors). n The N:C ratio of human-activated T cells (n = 679) as a function of cell volume, indicating a mean ratio of 0.55. Scale bars: 10 μm (g), 1 μm (k). Source data are provided as a Source Data file.

