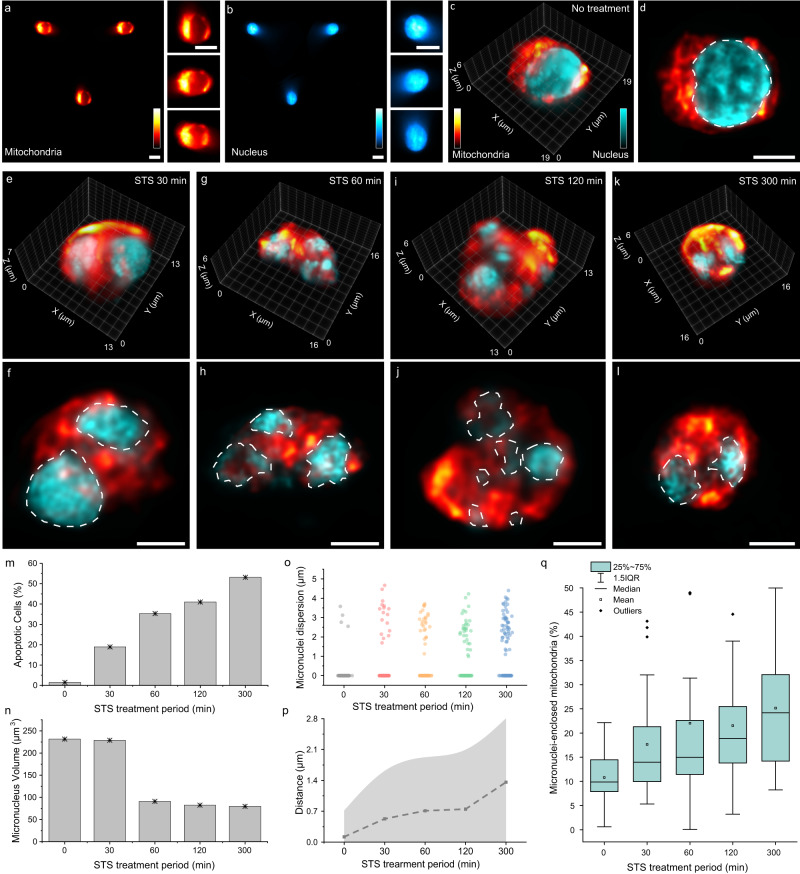
Fig. 5. Morphological changes in STS-treated Jurkat cells visualized through LFC.
Denoised light-field images of mitochondria (a) and nucleus (b) in a live Jurkat cell without STS treatment. Corresponding insets show the zoomed-in elemental images. These LFC images are representatives of >200 cell images acquired under identical experimental conditions. 3D reconstructed image (c) and one focal stack image (d) of the cell in (a) and (b). The dashed line indicates the nucleus segmentation from surrounding mitochondria. 3D visualization of Jurkat cells treated with STS for 30 (e), 60 (g), 120 (i), 300 (k) min and their corresponding focal stack images (f, h, j, l), respectively, exhibiting fragmented and condensed nuclear dispersion throughout the cells. m Percentage of the cells showing apoptotic cell morphology for each STS treatment period. n Average volumes of the micronuclei in cells for each STS treatment period. o Scatter plots displaying the average distance between individual micronuclei and their centroid for each cell for every STS treatment period. Intact nuclei with a distance of 0 µm account for 96%, 83%, 74%, 69%, and 49% of the total number of cells treated for 0 (i.e., no treatment), 30, 60, 120, and 300 min, respectively. p Mean (dashed) and standard deviation (shaded) of the distances in (o) for each STS treatment period, showing increased dispersion of fragmented nuclei. The sample size in (m–p) is 100 for each group. q Box plots illustrating the distribution of the volume of mitochondria enclosed within micronuclei relative to the total volume of micronuclei and mitochondria for individual cells across various STS treatment durations (n = 30 cells/group). The boxes represent data from the first quartile to the third quartile. The whiskers represent data ranging within 1.5 interquartile range (IQR) values. The lines and squares within the boxes represent the medians and means for each group, respectively. The diamond data points represent outliers of the data. Scale bars: 10 μm (a, b), 5 μm (d, f, h, j, l). Source data are provided as a Source Data file.

