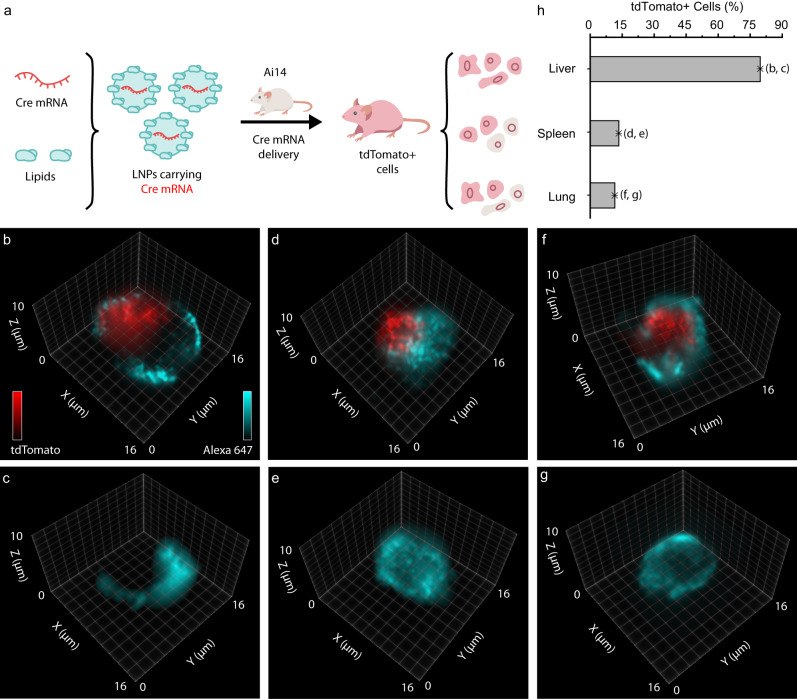
Fig. 6. Detection of Cre mRNA expression with lipid nanoparticle (LNP)-delivery in isolated mouse cells.
a Schematic representation of LNP formulation and delivery to cells in various organs of Ai14 mice. 3D visualization of a liver endothelial cell with (b) and without (c) the expression of tdTomato. 3D visualization of a spleen immune cell with (d) and without (e) the expression of tdTomato. 3D visualization of a lung endothelial cell with (f) and without (g) the expression of tdTomato. h Bar plot illustrating the percentage of tdTomato+ expression of 79.41%, 13.45%, and 11.39%, respectively, for liver (n = 102), spleen (n = 316), and lung (n = 119) cells. Source data are provided as a Source Data file.

