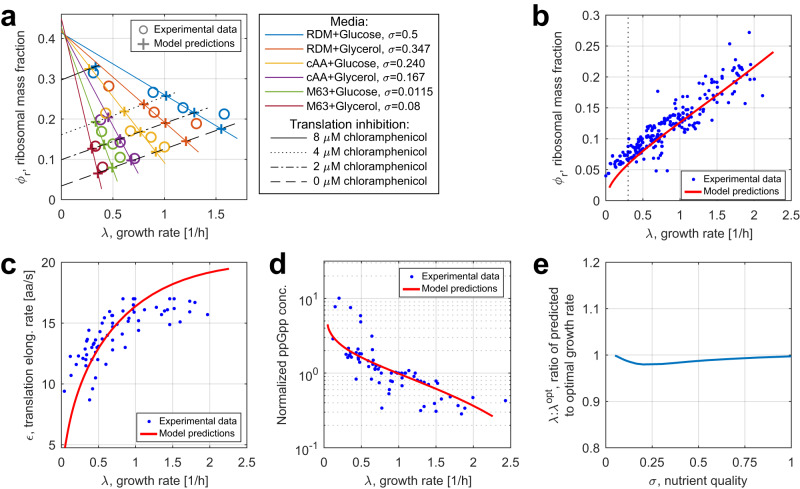
Fig. 3. Growth phenomena predicted by our model.
a Experimental measurements by Scott et al.19 used in parameter fitting (circles) and model predictions (crosses) for steady-state ribosomal mass fractions and growth rates. The first and the second growth laws are illustrated by varying culture media and extents of translation inhibition, respectively. Second growth law fits do not include the two predicted points for translation inhibition with 8 μM of chloramphenicol due to them diverging from the linear growth law trend. Chloramphenicol action was modeled as outlined in Supplementary Note S2.1. b–d Comparison of model predictions (obtained by simulating Eqs. (15)–(20)) for the cell in steady state with experimental data from previous studies26. In (b), the dotted vertical line denotes the threshold, left of which model predictions for significantly diverge from the experimental data. In (d), the ppGpp levels are normalized to the reference value for which . e Ratio of the steady-state growth rate predicted by our model to the optimal growth rate for σ varied from 0.05 to 1. For each medium nutrient quality σ considered, we did the following. First, we recorded the steady-state cell growth rate (here, the bar notation indicates a variable’s steady-state value) predicted by our model. According to it, T, the inverse of ppGpp concentration, reflects the charged and uncharged tRNA levels as detailed by Eq. (28). Then, we assumed that ppGpp concentration in the cell is instead constant, ran simulations for different fixed values of T and identified the maximum steady-state cell growth rate across all considered values. Source data are provided as a Source Data file.

