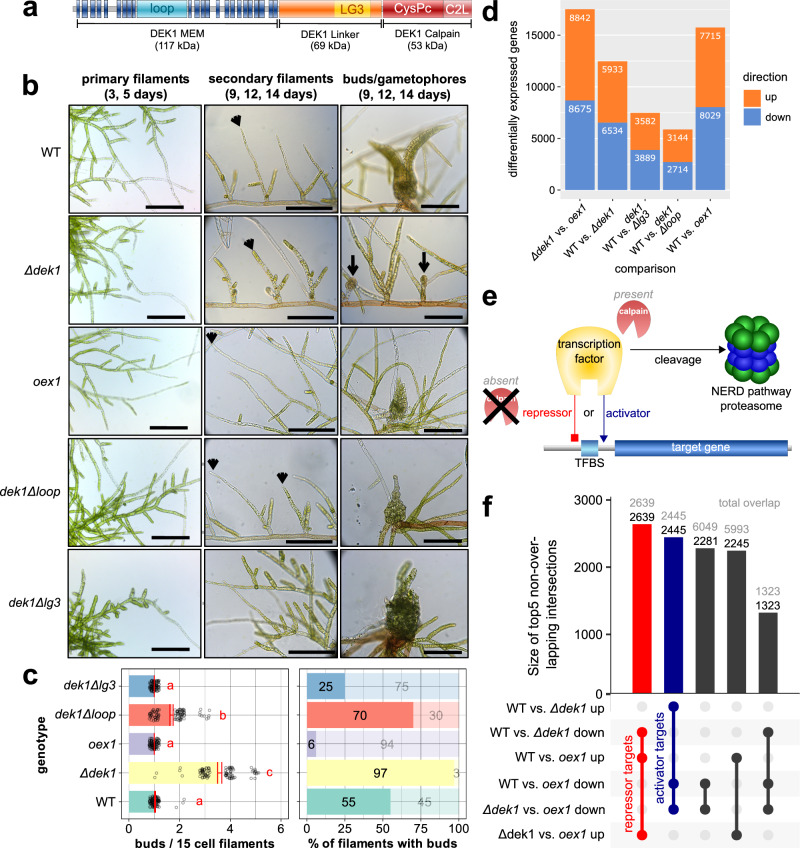
Fig. 1. Phenotypes and transcriptome profiling of dek1 mutant lines in P. patens.
a DEK1 protein domain structure. b Time series analysis of P. patens juvenile gametophyte development in WT, a DEK1 calpain domain overexpressor (oex1), a complete deletion of the DEK1 gene (Δdek1)10 and two partial deletion lines lacking the loop (dek1Δloop11); or the LG3 domain (dek1Δlg314). Microscopy images (scale bars: 200 μm) show primary filaments in early stages of protonemata development (3, 5 days), secondary filaments (9–14 days; arrowheads point to apical cells of individual secondary filaments), buds and gametophores (9–14 days; arrows point to arrested buds in Δdek1). c Quantitative analysis of gametophore apical stem cell (bud) formation in dek1 mutants (y-axes both panels: color-coded genotypes). The frequency of meristem initiation is expressed as mean number of buds per 15-cell-long filament (left panel, n = 100) and percentage of filaments forming buds (right panel, n = 100). Statistical significance at 95% confidence is indicated in left panel for mean number of buds (red annotation: a–c). Analysis of variance (ANOVA) and least significant difference (LSD) test were performed in multiple sample comparisons. Individual black open circles in left panel indicate individual data points. Red error-bars in left panel indicate standard errors. Lighter colored bars (alpha transparency) in right panel indicate percentages of filaments without bud. d Pairwise differential time series gene expression analysis of dek1 mutants at 3, 5, 9, 12 and 14 days. Stacked bar chart of significantly differentially expressed genes (DEGs) with a false discovery rate (FDR) < 0.1. Orange, upregulated genes; light blue, downregulated genes. e Working model for the gene-regulatory role of DEK1/calpains. When active calpain is present, a TF is cleaved and targeted to the N-end rule degradatory (NERD) pathway, resulting in loss of gene regulation. In the absence of active calpain, the TF regulates target gene expression either as an activator (blue) or repressor (red). f Size of the top 5 intersections between the DEG sets in (d). Numbers above bars depict the proportion unique to the given set (black) as well as the total (gray) size of each intersection. The largest set (red) comprises 2639 genes, which are downregulated in Δdek1 and upregulated in oex1, making these genes targets of DEK1-controlled repressors. The second-largest set (blue) comprises 2445 genes that are upregulated in Δdek1 and downregulated in oex1, likely controlled by DEK1-targeted activators. These sets represent the most conservative lists, as the third intersection likely contains additional activator targets with weak FDR support in the comparison of Δdek1 and the WT.

