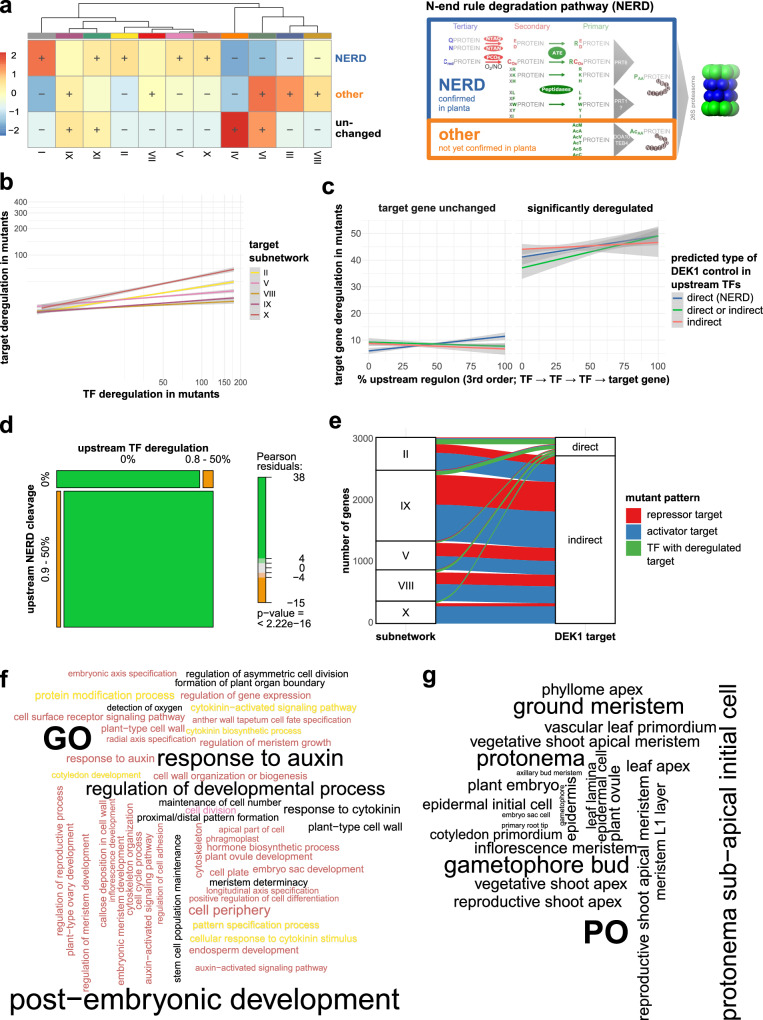
Fig. 3. Loss of DEK1 function causes global misregulation of the moss GRN in accordance with the pleiotropic phenotype of dek1 mutants and is consistent with a post-translational role of plant calpain in the regulation of TF stability.
a Network enrichment analysis (NEAT) of the prevalence of three specific N-terminal amino acid signature types in predicted calpain cleavage sites of encoded moss proteins. Two of these signature types have been identified in mammals to activate the NERD pathway, resulting in ubiquitylation and subsequent degradation by the 26S proteasome (extended panel on the right adapted from ref. 34). While the first route has been confirmed to be active in the moss and other plants (NERD), the second route (other) via acetylation of N-terminal residues has not yet been demonstrated in planta. The third class represents proteins with no cleavage or sites with N-terminal residues that would not attract the NERD pathway (unchanged). The heatmap shows the ratio between observed and expected sizes of specific candidate gene sets encoding for proteins enriched for these types of cleavages among the identified subnetworks. Significant (FDR < 0.01) enrichment (+) or depletion (−) is shown. b Target gene misregulation in dek1 mutants is positively correlated with the misregulation of direct upstream TFs. Linear relationship of target gene and TF misregulation in DEK1 mutants in the five most affected subnetworks. Misregulation of both types of genes is again depicted as the cumulative effect size of the LRTs in each gene. Lines depict the result of generalized linear regression of the cumulative misregulation of TF genes (x-axis) and their target genes (y-axis) for each of the five subnetworks. Gray areas depict 95% confidence intervals. c Target gene misregulation shows a positive, linear correlation with the fraction of directly and indirectly DEK1 calpain-controlled upstream TFs. Linear regression analysis of the cumulative misregulation of target genes (y-axis; sum of Likelihood-ratio test (LRT) effect sizes) and the percentage of the upstream TFs for each gene where TFs are either directly NERD-targeted by DEK1 (blue line; i.e., classified as NERD-type cleavage, a), indirectly DEK1 targeted (orange line; i.e., significantly misregulated; contained in gene sets displayed in b and Fig. 1f) or either of the two types (green line) for unchanged (left plot) and significantly misregulated (right plot; FDR < 0.1) target genes. Upstream regulons for each target gene in subnetworks II, V and X were evaluated up to third-order relationships. Gray areas depict 95% confidence intervals. d DEK1 calpain-dependent misregulation in the three subnetworks implementing the 2D-to-3D transition: misregulated genes in subnetworks II, V and X display significant enrichment of putative NERD-type calpain cleavages and misregulation of upstream TFs. Mosaic plot showing the relative proportions of significantly misregulated genes in dek1 mutants depending on the binary status of their upstream regulon with respect to predicted levels of DEK1 control (x-axis: predicted NERD-type calpain cleavages i.e., direct DEK1 targets; y-axis indirect DEK1 targets). Binary status defines whether the regulon comprises TFs predicted as direct (x) or indirect (y) DEK1 targets (>0% of the TFs) or not (= 0% TFs). Boxes are colored based on Pearson residuals from a significant χ2 test of the cross-table comparing the proportions of both binary classes. e Alluvial plot depicting the distribution of the filtered, predicted direct and indirect DEK1 targets among the five predominantly controlled subnetworks. Color-coding of bands reflects directionality of misregulation patterns in the mutant lines (see Fig. 1f for details). Green bands represent unaffected upstream TFs predicted to control the significantly misregulated target genes. f Significantly enriched Gene Ontology (GO) terms associated with direct and indirect DEK1 target genes are overrepresented in processes related to observed DEK1 phenotypes in flowering plants and the moss. Word cloud depicts filtered, significantly enriched GO biological processes and cellular components (FDR < 0.1). Text color code depicts subnetwork identity (i.e., subnetworks II, V and X) of (indirect) target gene. Black text corresponds to overall enrichment among target genes. g Overrepresented tissue and cell type localizations consistent with dek1 phenotypes and expression patterns. Based on enrichment analysis using Plant Ontology (PO) term annotations for moss genes or their flowering plant orthologs. Word cloud of selected plant anatomical entity PO terms displaying an overall enrichment among direct and indirect DEK1 target genes (FDR < 0.1).

