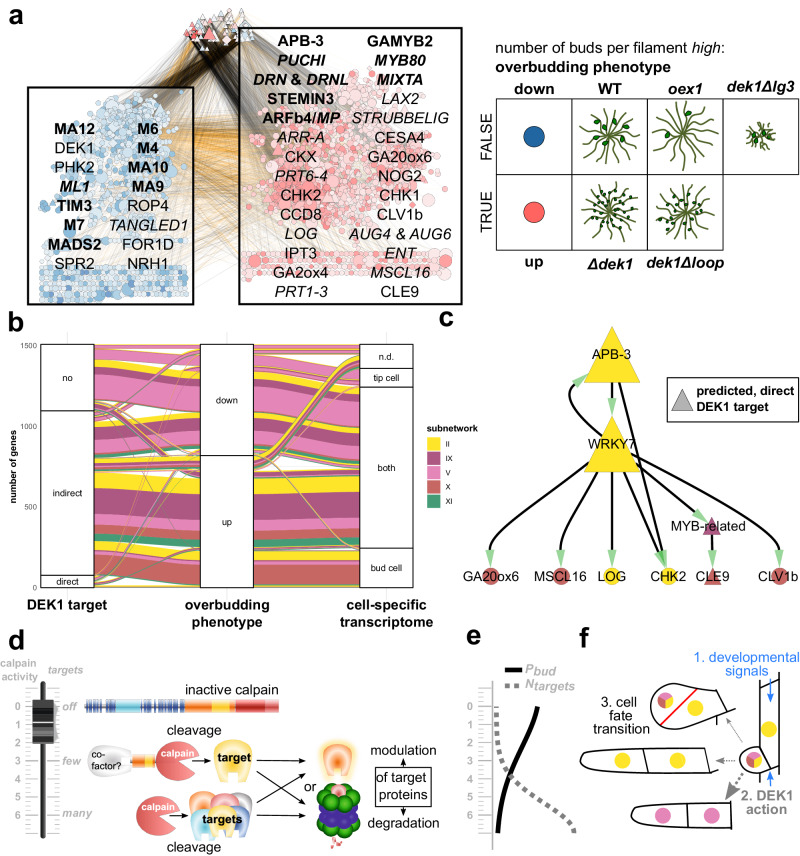
Fig. 4. Tracing the overbudding mutant phenotype to deeply conserved, DEK1-guarded meristematic regulons controlling the 2D-to-3D transition.
a Factorial Differential Gene Expression Network Enrichment Analysis (FDGENEA) of the overbudding phenotype reveals enriched subnetworks and upstream regulators associated with high number of buds per filament that comprise key factors in plant meristematic and primordial cell fate control. Network plot of genes with significant association to overbudding (left [blue: overbudding = FALSE] and right node [red: overbudding = TRUE] groups in background of overlaid text boxes) and direct, upstream regulators without significant association (top node group). Foreground text boxes display exemplary, predicted DEK1 targets from the overbudding up regulated (right = red) and downregulated (left = blue) gene sets with experimental evidence in flowering plants or the moss. Bold font indicates TFs; italic font indicates predicted moss genes whose Arabidopsis orthologs have consistent experimental data connected to DEK1 phenotypes. Nodes are color-coded by the kind and strength of a gene’s association with the overbudding trait (color intensity gradient relative to Log-fold-change in DGE analysis; up = positive = red; down = negative = blue). Node sizes relative to the cumulative, absolute misregulation fold-change of the respective gene and any predicted downstream target gene in the mutants. Node shapes: triangles, TFs; diamonds, transcription regulators; inverted triangles, miRNAs, circles, targets. Edge color and intensity: correlation coefficient of connected nodes in dek1 RNA-seq data (black = positive; orange = negative). Panel at right depicts genotypes used and respective phenotypic character state of the overbudding trait (number of buds per filament high: FALSE ⇔ TRUE) in WT and dek1 mutant lines. b Overbudding-upregulated DEK1 targets from subnetworks II and X are enriched in the previously identified bud cell transcriptome23. Alluvial diagram depicts the proportional distribution of subnetworks shared between three categorical sets: left to right, DEK1 target: predicted direct and indirect DEK1 targets; overbudding phenotype: genes with significant association with the overbudding phenotype (up ⇔ down); cell-specific transcriptome; n.d., not detected; specific to protonemal tip cell; detected but no significant difference between both cell types; specific to gametophore bud cell. Band coloring is based on subnetworks. c Key components of the moss CLAVATA3-like peptide (CLE9) and receptor-like kinase (CLV1b) pathway are predicted to be downstream of an overbudding upregulated, DEK1-controlled regulon that comprises a 2D-to-3D master regulator (APB3) and integrates several developmental signals: gibberellin/kaurene (GA20ox6), cytokinin (LOG, CHK2), mechanical stress (MSCL16), peptide (CLE9). Network graph depicts the immediate regulatory context of CLV1b. Full regulatory context is shown in Supplementary Fig. S10i. Node sizes are relative to the overall local reaching centrality (fraction of downstream nodes in the global network). Node coloring based on subnetwork affiliation. Triangular nodes are predicted to represent direct cleavage targets of the DEK1 calpain. All predicted regulatory interactions are positive, i.e., show positive correlation in WT and mutants along the RNA-seq time course. d–f Proposed role of DEK1 as a fine-tunable, developmental switch gatekeeping cell fate transitions. Model illustrating the proposed relationship between the level of free calpain activity, the number of direct and indirect targets, and the developmental consequences in three panels with a shared y-axis (calpain activity). d Model describing three primary DEK1 calpain states (top to bottom): off: immobile, inactive calpain in full-length DEK1 protein in plasma membrane; few: mobile, constrained calpain, released by auto-catalytic cleavage at several possible locations in the Linker-LG3 domain (External File DEK1.jvp; level of calpain activity, localization, half-life and number/kind of targets might be dependent on co-factor interaction); many: mobile, unconstrained calpain, pure calpain released by auto-catalytic cleavage directly before or in the CysPc domain. e Proposed relationship between the number of DEK1 calpain targets (Ntargets = dashed curve) and the probability of a protonemal cell gaining the bud initial cell fate, i.e., gametophore apical stem cell (Pbud = solid curve). f Schematic drawing of the cellular fate transitions affected in the overbudding phenotype in three steps.

