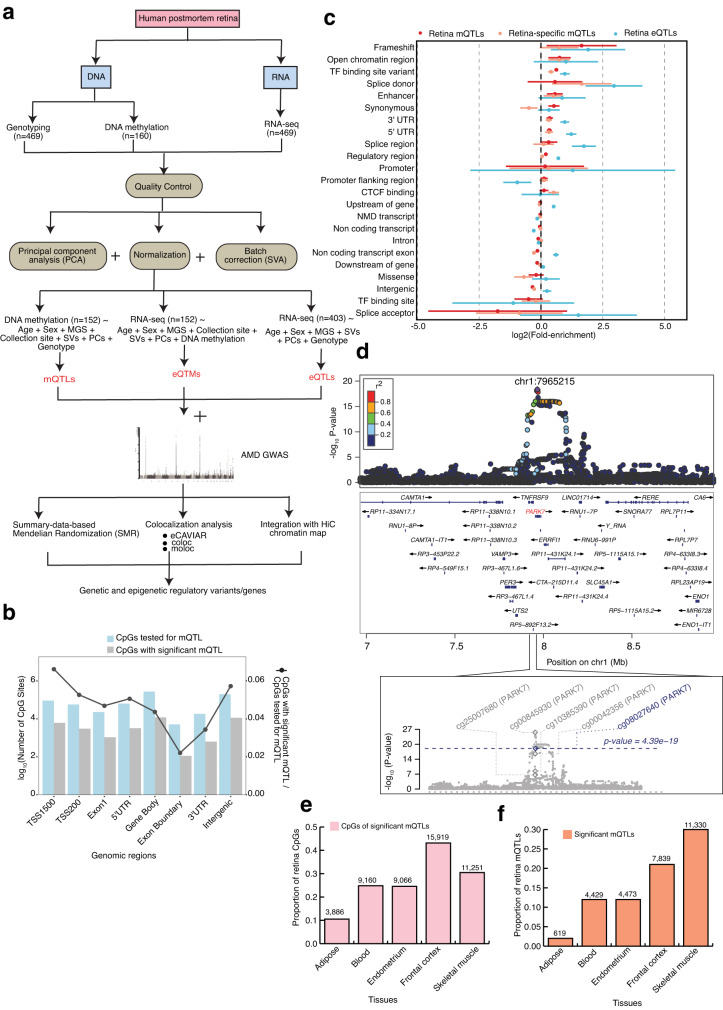
Fig. 1. Graphic summary of datasets generated, integrated and analyses performed in the present study and robust identification of retina mQTLs.
a Schematic representation of our genetic, epigenetic, and transcriptomic datasets and methods used in the identification and integration of methylation quantitative trait loci (cis-mQTL), expression quantitative trait loci (cis-eQTL) and expression quantitative trait methylation (cis-eQTM) with AMD GWAS and retina Hi-C chromatin map. b Number of CpG sites tested (blue) and significant (grey) in various genomic regions in mQTL analysis. c QTL enrichment in functional annotations for all retina (red) or retina-specific (orange) cis-mQTLs identified from n = 152 biologically independent samples and all retina cis-eQTLs identified from n = 403 biologically independent samples (blue). Points (centre) refer to m/eQTL fold-enrichment estimates on log2 scale with 95% confidence intervals (lines), shown in descending order based on the retina mQTL fold-enrichment across annotations with >550 variants per QTL type. d LocusZoom plot showing the retina mQTL association, −log10(P value) for the top mQTL signal with CpG (cg08027640) with P value = 4.39 × 10⁻¹⁹ for PARK7 gene. The diamond indicates the top mVariant (chr1:7965215:C:T; rs7517357) for the independent cg08027640 mQTL signal. The color of the points is determined by their linkage disequilibrium (LD) with respect to the lead mVariant in purple. The bottom plot shows −log10(P values) of the variant association with five different CpGs in PARK7 gene region from mQTL results. The grey and blue diamond’s represent −log10(P values) of the lead mVariants for four CpGs and cg08027640, respectively. e Proportion of retina CpGs with significant mQTLs that are also significant mQTLs across different tissues. f Proportion of retina mQTLs that are also significant mQTLs across different tissues.

