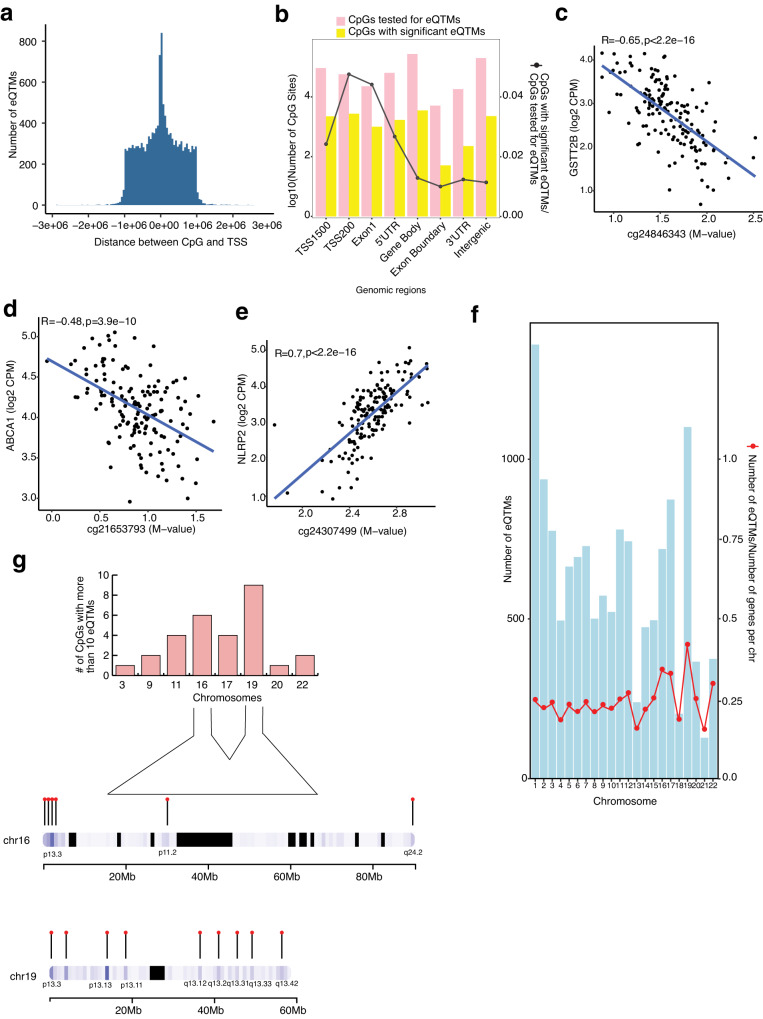
Fig. 2. Characterization and distribution of retina eQTMs.
a Distribution of the distance between the CpG and the transcription start site (TSS) of the respective gene is plotted against the number of eQTMs. b Combination chart representing the number of CpG sites tested (pink) and significant (yellow) in various genomic regions in eQTM analysis. c, d, e DNAm levels are presented on the X-axis and the normalized gene expression levels are shown on the Y-axis. Pearson’s correlation coefficient (R) was calculated between methylation and gene expression. c eQTM for CpG cg24846343 located in gene body and GSTT2B on chromosome 22 with R = −0.65, p < 2.2 × 10⁻¹⁶. d eQTM for CpG cg21653793 located in 5’UTR and ABCA1 on chromosome 9 with R = −0.48, p = 3.9 × 10⁻¹⁰. e eQTM for CpG cg24307499 located in gene body and NLRP2 on chromosome 19 with R = 0.7, p < 2.2 × 10⁻¹⁶. f Distribution of number of eQTMs on different chromosomes and eQTM fraction (red points) relative to the total number of genes per chromosome. g Top panel: Number of CpGs that regulate more than 10 eQTMs and are distributed on various chromosomes. Bottom panel: Cluster of CpGs on chromosomes 16 and 19 on arm p and q.

