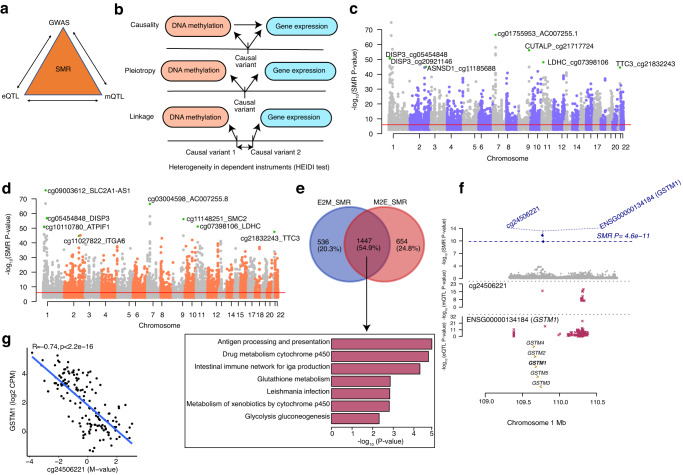
Fig. 3. Associations between retina DNA methylation and gene expression through genotypes.
a Schematic of bidirectional integrative analysis that integrates summary-level data from independent GWAS with data from retina mQTL and eQTL. b Heterogeneity in dependent instruments (HEIDI) model to distinguish pleiotropy from linkage for an observed association between DNAm and gene expression through genotypes. c Manhattan plot of SMR tests for association between gene expression and DNAm (E2M_SMR). Shown on the y axis are the −log10(P value) from SMR tests. The red horizontal lines represent the genome-wide significance level (SMR P value = 9.29 × 10⁻⁷). d Manhattan plot of SMR tests for association between DNAm and gene expression (M2E_SMR). Shown on the y axis is the −log10(P value) from SMR tests. The red horizontal lines represent the genome-wide significance level (SMR P value = 9.38 × 10⁻⁷). e Venn-diagram representing common and unique genes identified in E2M_SMR and M2E_SMR associations and bar graph representing the enriched pathways identified in the pathway analysis of common genes at FDR < 0.05. The y axis shows the −log10(Empirical P value) from GeneEnrich. f Results of variants and SMR associations across DNAm and gene expression (M2E_SMR) in the GSTM1 locus on chromosome 1. The top plot shows −log10(SMR P values) of SNPs from the SMR analysis of DNAm and gene expression (M2E_SMR). The blue diamonds represent −log10(SMR P value) from SMR tests for associations of DNAm and GSTM1 expression with SMR P value = 4.6 × 10⁻¹¹. The second plot shows −log10(P values) of the SNP association for DNAm probe cg24506221 from the mQTL data. The third plot shows −log10(P values) of the SNP associations for gene expression of GSTM1 from the eQTL data. g eQTM for CpG cg24506221 located in TSS200 region and GSTM1 on chromosome 1. DNAm levels of cg24506221 are presented on the X-axis and the normalized gene expression levels are shown on the Y-axis. Pearson’s correlation coefficient was calculated between methylation and gene expression with R = −0.74, p < 2.2 × 10⁻¹⁶.

