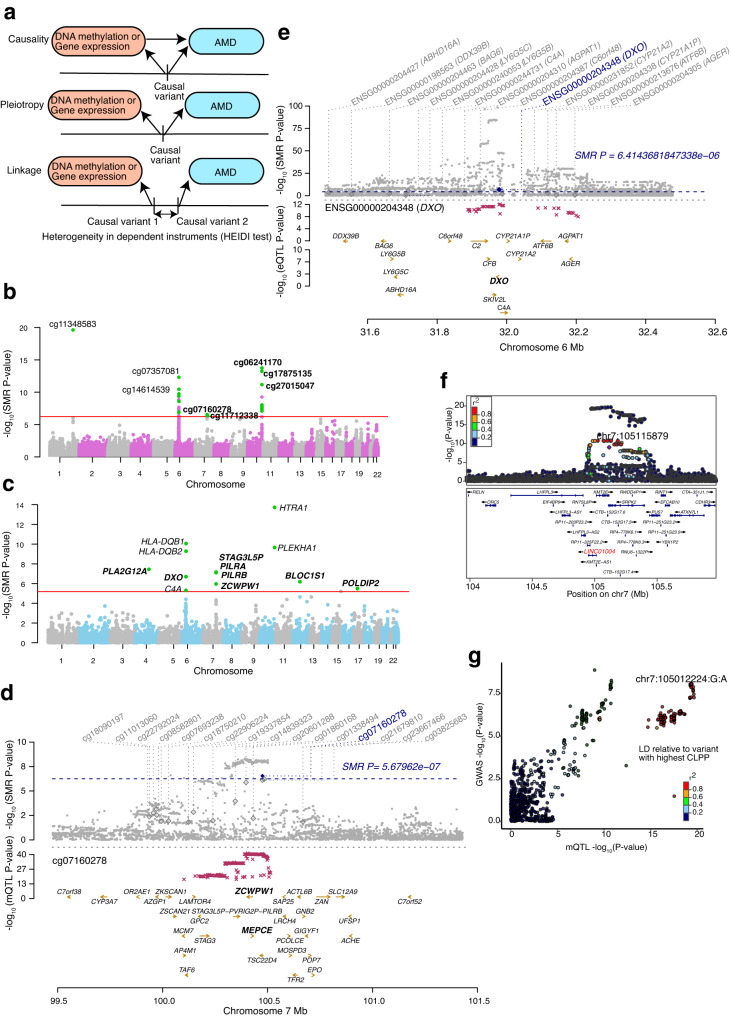
Fig. 4. Associations between retina DNA methylation, gene expression and AMD GWAS through genotypes.
a Heterogeneity in dependent instruments (HEIDI) model to distinguish pleiotropy from linkage for an observed association between AMD, DNAm and/or gene expression through genotypes. b Manhattan plot of SMR tests for association between retina mQTL and AMD GWAS. Shown on each y axis are the −log10(SMR P values) from SMR tests. The red horizontal lines represent the genome-wide significance level (SMR P values = 5.67 × 10⁻⁷). c Manhattan plot of SMR tests for association between retina eQTL and AMD GWAS. The red horizontal lines represent the genome-wide significance level (SMR P values = 5.4 × 10⁻⁶). d Results of variants and SMR associations across retina mQTL and AMD GWAS. The top plot shows −log10(SMR P values) of SNPs comparing mQTL and AMD GWAS. The blue diamonds represent −log10(SMR P value) from SMR tests for associations of mQTL and AMD GWAS with SMR P value = 5.67 × 10⁻⁷. The second plot shows −log10(SMR P value) of the SNP associations for DNAm probe cg07160278 from the mQTL data. e Results of variants and SMR associations across retina eQTL and AMD GWAS. The top plot shows −log10(SMR P value) of SNPs from eQTL and AMD GWAS. The blue diamonds represent −log10(SMR P value) from SMR tests for associations of eQTL and AMD GWAS with SMR P value = 6.41 × 10⁻⁶. The second plot shows −log10(SMR P value) of the SNP associations for DXO gene from the eQTL data. f LocusZoom plot of the retina mQTL associations for cg11712338 (LINC01004). −log10(P value) of retina mQTL with points color coded based on LD (r2) relative to the lead AMD GWAS variant (chr7:105115879:C:T; rs1142) in the locus KMT2E/SRPK2. g LocusCompare plot comparing −log10(P value) of AMD GWAS to −log10(P value) of retina mQTLs acting on cg11712338 (LINC01004).

