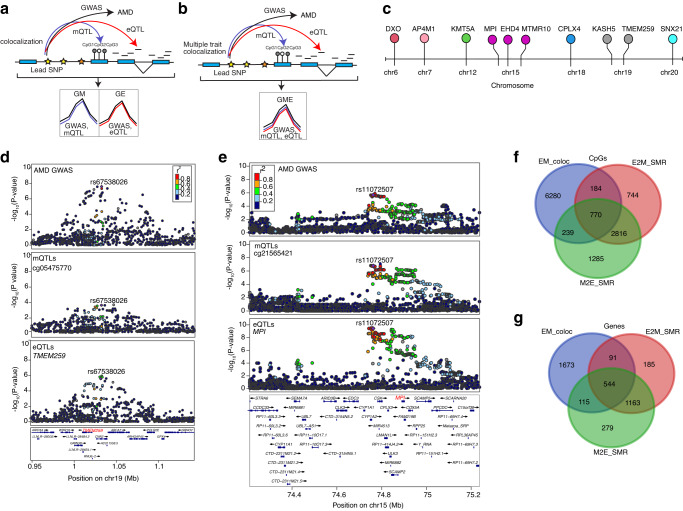
Fig. 5. Colocalization analysis among AMD GWAS and retina mQTL and eQTL using Coloc and Moloc.
a Schematic representation of colocalization analysis of AMD GWAS with retina mQTL or eQTL. b Schematic representation of multiple trait colocalization analysis of AMD GWAS, retina mQTL and eQTL. c Lolliplot depicting the target genes identified in the multiple trait colocalization analysis (moloc) of AMD GWAS, retina mQTL and eQTL. The colors correspond to genes on different chromosomes. d LocusZoom plots of AMD GWAS (genotype and GWAS association), CpG cg05475770 mQTLs (genotype and cg05475770 methylation association), and TMEM259 eQTLs (genotype and TMEM259 expression association). The y axis shows −log10(P-value) of association tests from GWAS, mQTLs and eQTLs. Points are color coded based on LD (r2) relative to the variant with highest colocalization posterior probability in the locus, rs67538026, identified in moloc analysis of AMD GWAS, mQTLs and eQTLs (GEM). e LocusZoom plots of AMD GWAS (genotype and GWAS association), CpG cg21565421 mQTLs (genotype and cg21565421 methylation association), and MPI eQTLs (genotype and MPI expression association). The y axis shows −log10(P value) of association tests from GWAS, mQTLs and eQTLs. Points are color coded based on LD (r2) relative to the variant with highest colocalization posterior probability in the locus, rs11072507, identified in moloc analysis of AMD GWAS, mQTLs and eQTLs (GEM). f Venn-diagram representing common and unique CpGs identified in associations between retina eQTLs and mQTLs using moloc (EM_coloc), CpGs identified in associations between retina eQTLs and mQTLs using SMR (E2M_SMR), and CpGs identified in associations between retina mQTLs and eQTLs using SMR (M2E_SMR). g Venn-diagram representing common and unique target genes identified in associations between retina eQTLs and mQTLs using coloc (EM_coloc), genes identified in associations between retina eQTLs and mQTLs using SMR (E2M_SMR), and genes identified in associations between retina mQTLs and eQTLs using SMR (M2E_SMR).

