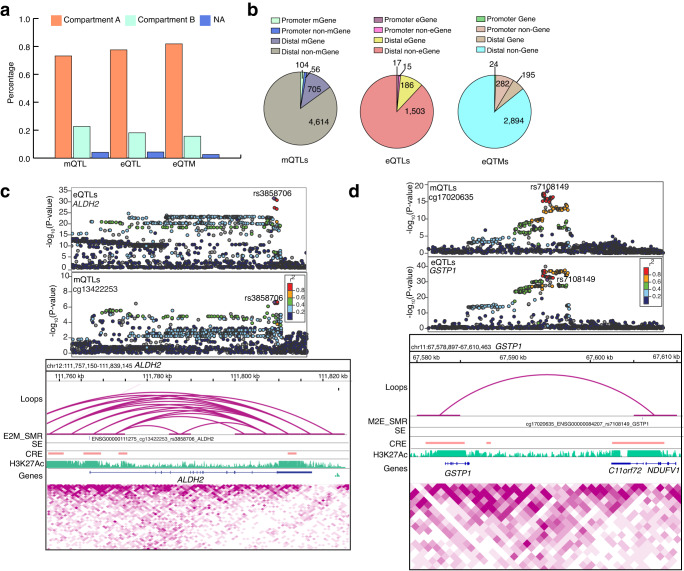
Fig. 6. Hi-C retina data enables target gene and variant prioritization.
a Proportion of unique retina mQTLs, eQTLs and eQTMs overlapping each chromatin compartment. b Number of unique retina mQTLs, eQTLs and eQTMs overlapping with a loop that are in contact with variants located within ±2.5 kb of the mGene/eGene/Gene TSS were identified as promoter mQTLs/eQTLs/eQTMs, while those located >2.5 kb from the mGene/eGene/Gene were identified as distal mQTLs/eQTLs/eQTMs. c Upper panel: LocusZoom plots of ALDH2 eQTLs (genotype and ALDH2 expression associations) and CpG cg13422253 mQTLs (genotype and cg13422253 methylation associations). The y axis shows −log10(P value) of eQTL and mQTL association tests. Points are color coded based on LD (r2) relative to the highlighted variant rs3858706, the most significant variant in E2M_SMR analysis of eQTLs and mQTLs. The lower panel includes associations identified in E2M_SMR for ALDH2 gene. Tracks represent the retina chromatin loops, E2M_SMR significant variant, SEs, CREs, H3K27Ac coverage, genes, and Hi-C physical contact maps identifying TADs. d Upper panel: LocusZoom plots of CpG cg17020635 mQTLs (genotype and cg17020635 methylation associations) and GSTP1 eQTLs (genotype and GSTP1 expression associations). The y axis shows −log10(P value) of association tests from mQTLs and eQTLs. Points are color coded based on LD (r2) relative to the highlighted variant rs7108149, the most significant variant in M2E_SMR analysis of eQTLs and mQTLs. The lower panel includes associations identified in M2E_SMR for GSTP1 gene. Tracks represent the retina chromatin loops, M2E_SMR variant, SEs, CREs, H3K27Ac coverage, genes, and Hi-C physical contact maps. CRE Cis-regulatory element, SE Super-enhancer, TAD Topologically associating domain.

