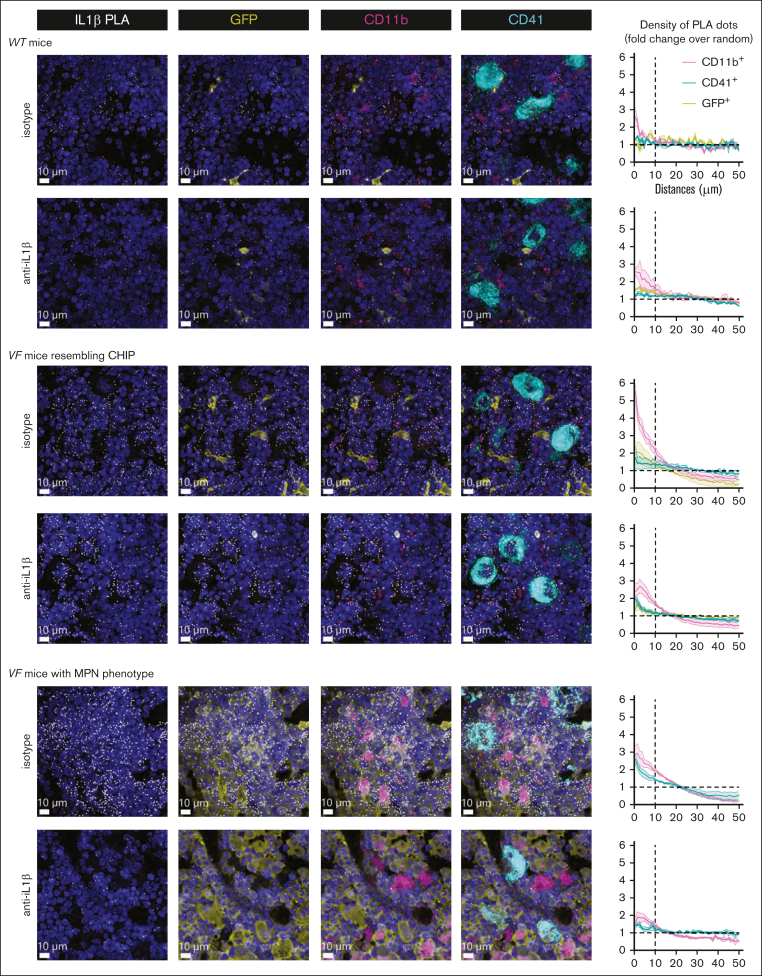
Figure 6.
In situ BM 3-dimensional fluorescence imaging with PLA for IL-1β single-molecule visualization. Representative images show the distribution of the IL-1β PLA signals relative to CD11b+ myeloid cells and CD41+ megakaryocytes in BM sections of VF and WT mice. The 3-dimensional spatial densities of PLA signals relative to the distances of the closest CD11b+ myeloid cells, CD41+ megakaryocytes or GFP+JAK2-mutant cells are shown in the graphs next to the pictures. See also supplemental Figure 9.

