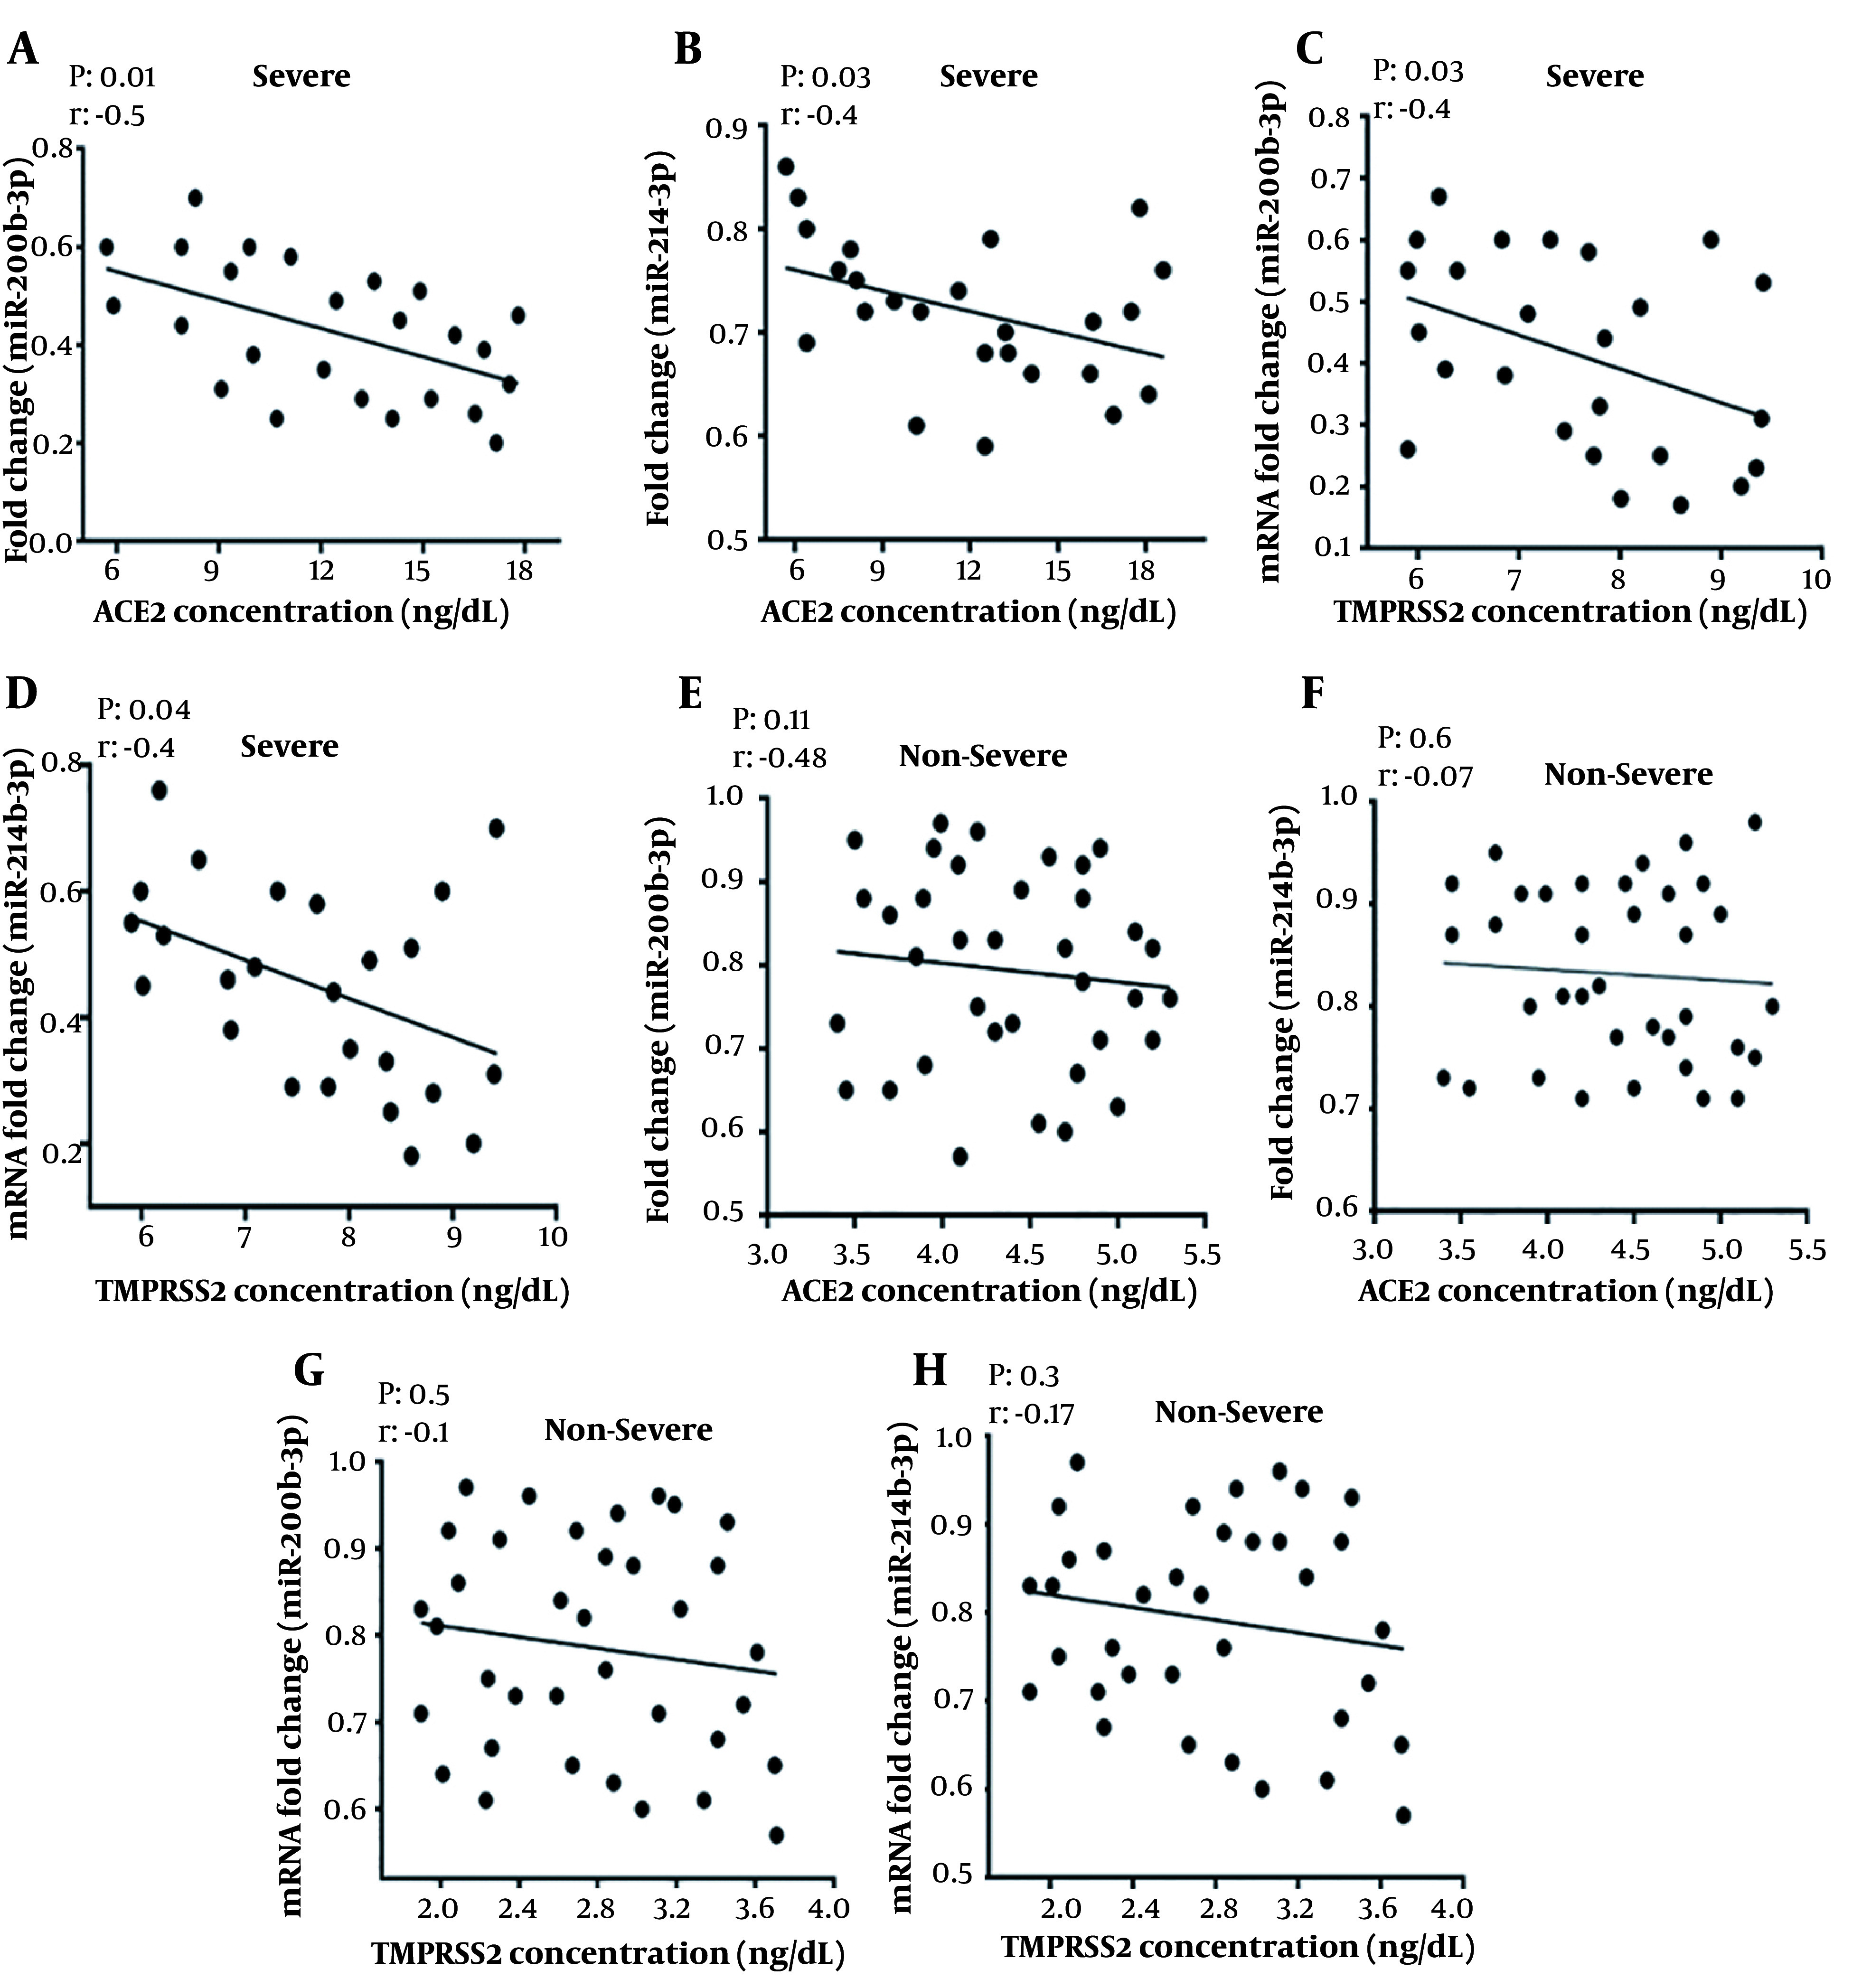
Figure 3. Correlation analysis of serum miR-200b-3p and miR-214-3p expression with soluble angiotensin-converting enzyme 2 (ACE2) and transmembrane serine protease 2 (TMPRSS2) concentrations in severe and non-severe coronavirus disease 2019 (COVID-19) patients; A, correlation analysis of soluble ACE2 and serum miR-200b-3p in severe COVID-19 patients; B, correlation analysis of ACE2 and miR-214-3p in severe patients; C, correlation analysis of TMPRSS2 and miR-200b-3p in severe patients; D, correlation analysis of TMPRSS2 and miR-214-3p in severe patients; E, correlation analysis of ACE2 and serum miR-200b-3p in non-severe COVID-19 patients; F, correlation analysis of ACE2 and miR-214-3p in non-severe patients; G, correlation analysis of TMPRSS2 and miR-200b-3p in non-severe patients; H, correlation analysis of TMPRSS2 and miR-214-3p in non-severe patients (The regression line is also illustrated. Pearson correlation [r] and P-value [P] are reported. A P-value < 0.05 was considered significant).

