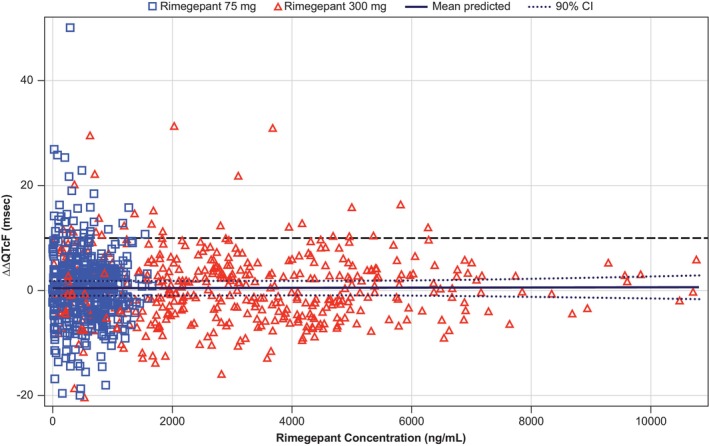
FIGURE 3.

Scatter plot of observed rimegepant plasma concentrations and ΔΔQTcF by participant (PK/QTc population). The solid black line with dashed black lines denotes the model‐predicted mean ΔΔQTcF with 90% CI. The blue squares and red triangles denote the pairs of observed rimegepant plasma concentrations and observed ΔΔQTcF by participants for the rimegepant 75 mg and rimegepant 300 mg treatment periods, respectively. ΔΔQTcF, placebo‐corrected change‐from‐baseline in Fridericia corrected QT interval; CI, confidence interval; PK, pharmacokinetic; QTc, corrected QT interval.
