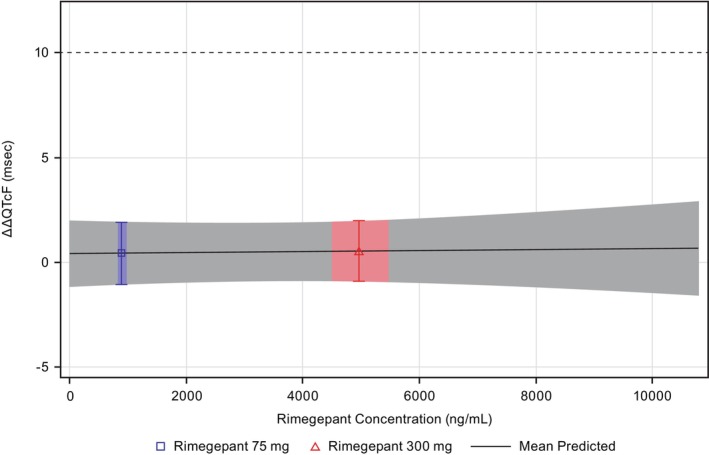
FIGURE 4.

Predicted ΔΔQTcF interval at geometric mean peak rimegepant concentration (PK/QTc population). The blue and red areas denote the estimated mean (90% CI) ΔΔQTcF at the geometric mean (90% CI) C max of rimegepant for the 75‐ and 300‐mg dose levels, respectively. The solid black line with gray shaded area denotes the model‐predicted mean (90% CI) ΔΔQTcF. ΔΔQTcF, placebo‐corrected change‐from‐baseline in Fridericia corrected QT interval; C max, maximum plasma concentration; PK, pharmacokinetic; QTc, corrected QT interval.
