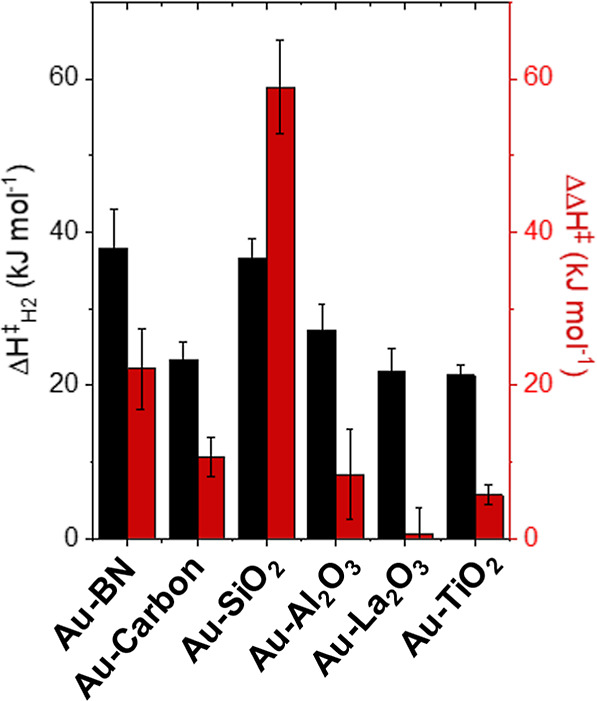
Figure 11.

Apparent activation enthalpies of hydrogen consumption (ΔHH2‡; black) and differences between activation enthalpies of H2O2 and H2O formation (ΔΔH‡; red) on 2–3 nm Au nanoparticles supported on BN, carbon, SiO2, Al2O3, La2O3, and TiO2 (200 kPa H2, 60 kPa O2, 278 K). Figure S23 shows associated steady-state rate measurements versus temperature.
